Was going to do the bar value mappings today but instead spent time working on a few pieces of UI/UX.
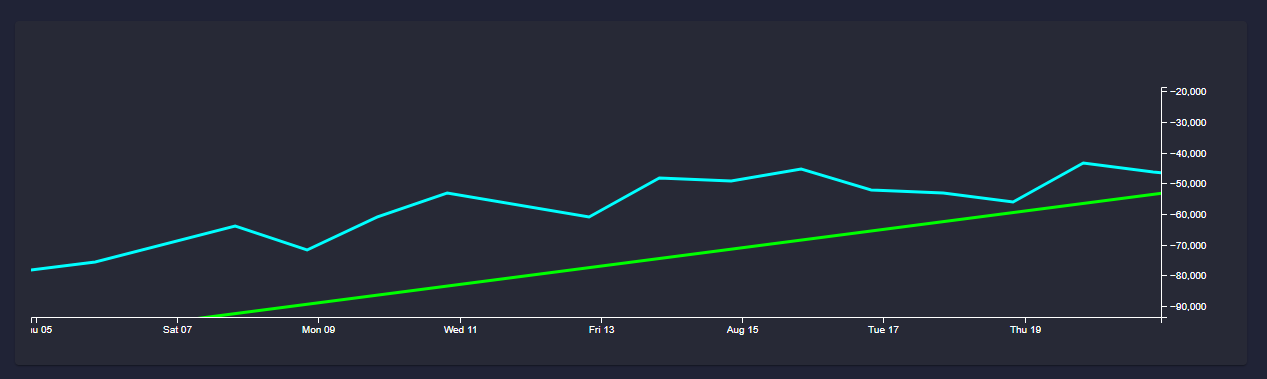
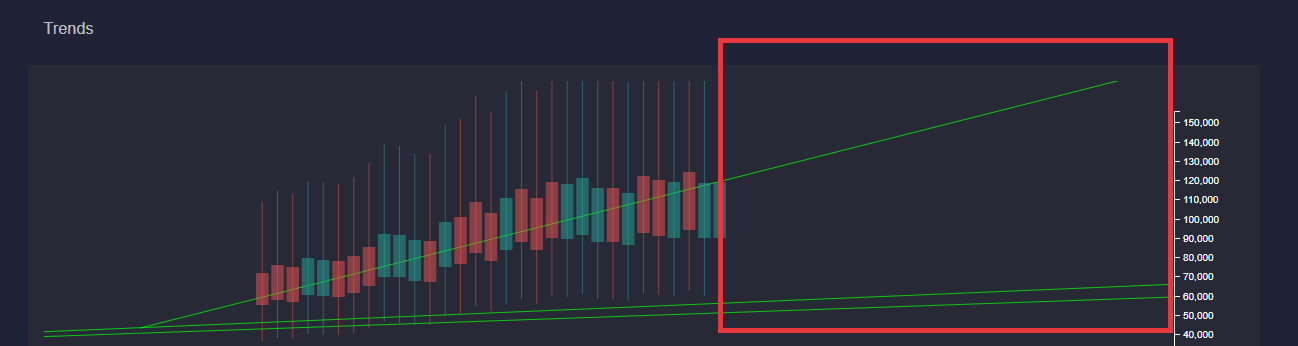
The most important of which is the trendlines are now finally drawn into the future!
This was super tricky to do and I am glad it's finally done as this is basically the core functionality that I couldn't find in charting libraries.
Tomorrow I plan to fix up the bars to properly reflect the on-chain data. Things are starting to come together, a couple more days and you will be able to play around with this. 🔥
I tried a bunch of charting libraries and there doesn't seem to be a good fit that has the functionalities I want.
I ended up continuing working on our custom chart powered by d3.js. This data visualization library will allow us to replicate the look & feel I want.
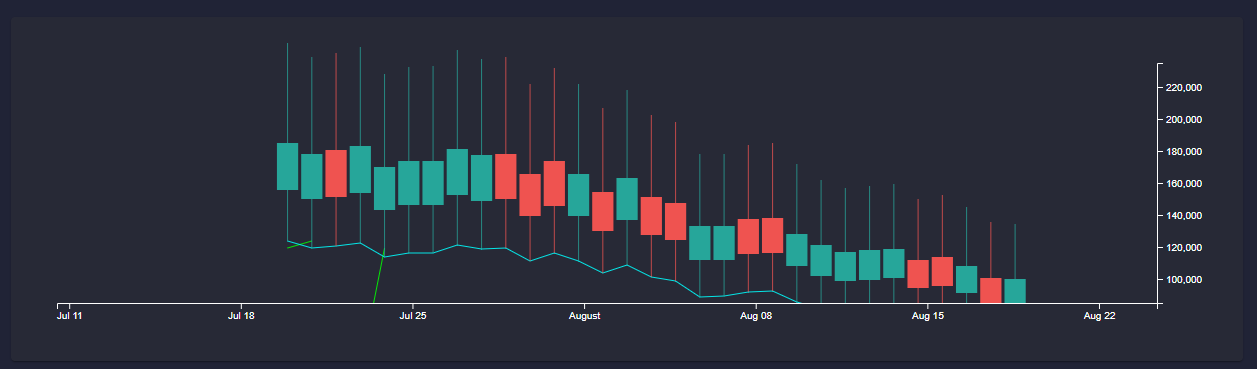
Today I've been able to convert the line chart into a custom bar chart. This bar chart will behave just like Tradingview one where there is no breaks between bars if multiple dates are missing in between.
Right now the bar data is random, tomorrow I will update the endpoint in Datamine Network to support on-chain, real-time bar feeds. Meaning we will know candle open/high/low/close with on-chain data... Something we have never done before.
My vision for real-time, on-chain trends is slowly becoming a reality and I can't wait to show you guys what it looks like at the end. 🔥
Today I've replicated the panning and zooming for the trend chart which will function like Trading View as I really like this set of controls. I've also fixed up the clipping for the chart.
There is one set of controls functionality to copy which is ability to scale X/Y axis by dragging them which I am to finish tomorrow.
I also need to convert line chart into bar chart which would be a good milestone for Tomorrow.
After that I will have to update the data feed to use the new bar data format. This would take us right into the last feature which is to draw trends in the future.
Overall it's quite a packed week and I want to finish this set of core features before launch, but I'll keep you guys updated. 🔥
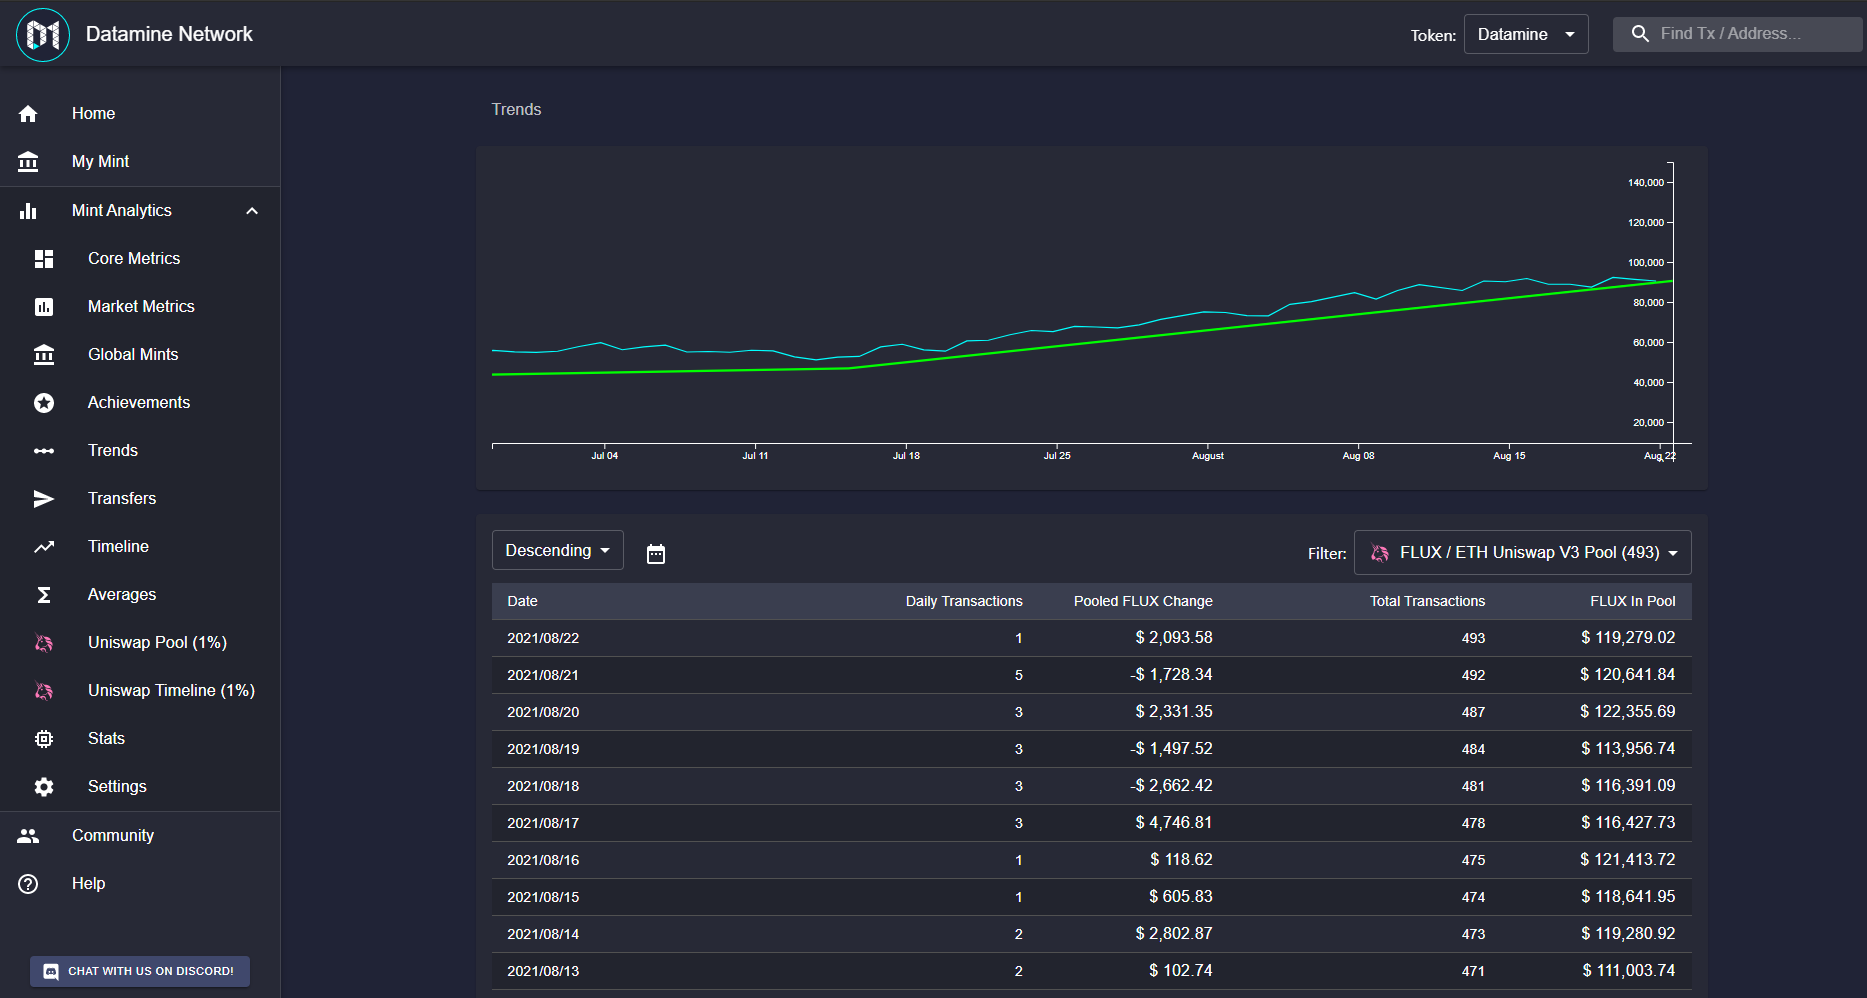
Wanted to show you an early view of the trends work in progress. Currently only the uptrends are visible and this is not the best demonstration of the technology.
We also need to convert these lines into a barchart otherwise it'll be very confusing how these trends are formed and how long they're active for.
I also picked a pretty bad data source to demonstrate with so I will have a better sample tomorrow with both uptrends and downtrends. 🔥
I have just finished writing the core of the new trend engine. Currently the USD/FLUX Uniswap V3 pool has 4 & 11 up/down active trends. We will see what they are tomorrow and further explanation is to follow as we chart them.
This is a great milestone and tomorrow I will start to add these trends to the charts display so we can see what this data look like!
There were a few new additions I had to add to the Datamine Network analytics as these trends are tricky to undo (as we have to re-do trends if Ethereum longest chain swap happens).
Super excited to see what these look like and an amazing place to finish the week. Be ready to witness the future of forecasting data this week! 🔥
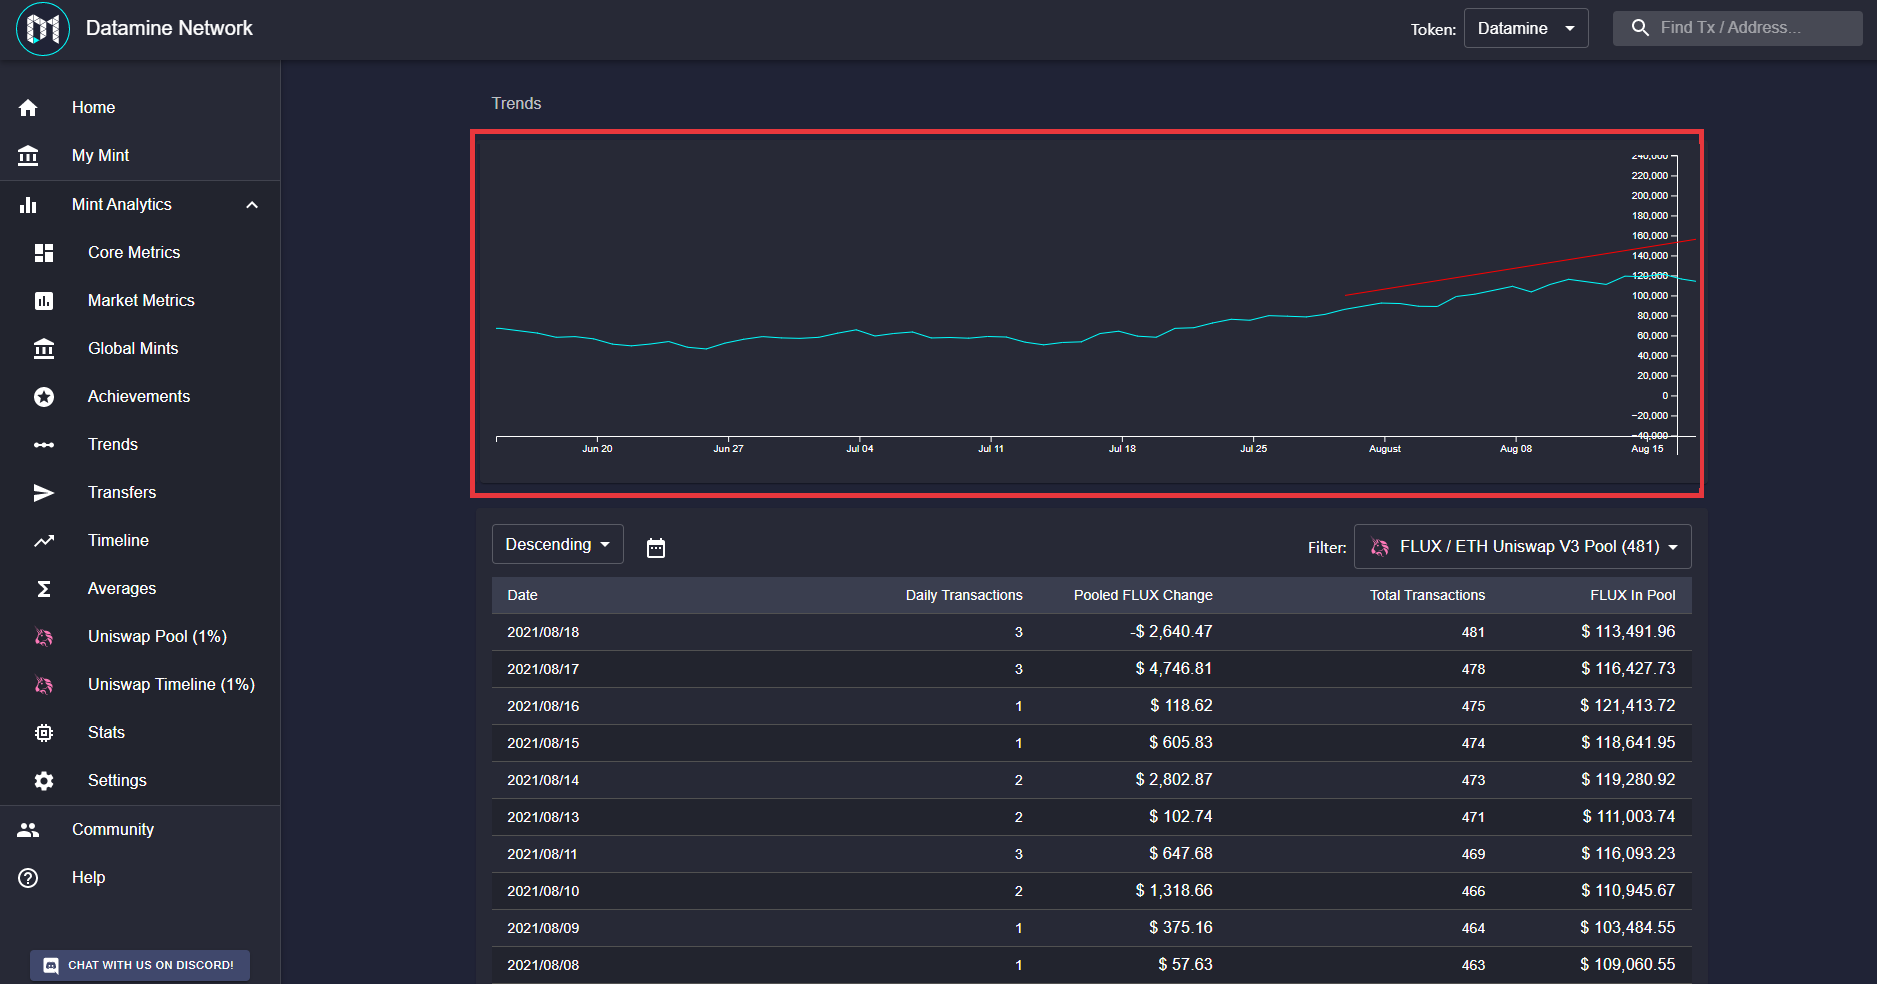
The price Uniswap historic pricing data from yesterday is now feeding into our new trends chart. Tomorrow I can finally start work on the actual trend engine to figure out the current price trends.
Expecting to get first version out to play around with this weekend. 🔥

 · hodlforjesus · #dev-updates
 DAM
DAM FLUX
FLUX · hodlforjesus ·