
Datamine Network Enhances Dashboard Charts with TradingView Controls
💡 AI Article Summary
TradingView-Style Interactive Chart Controls
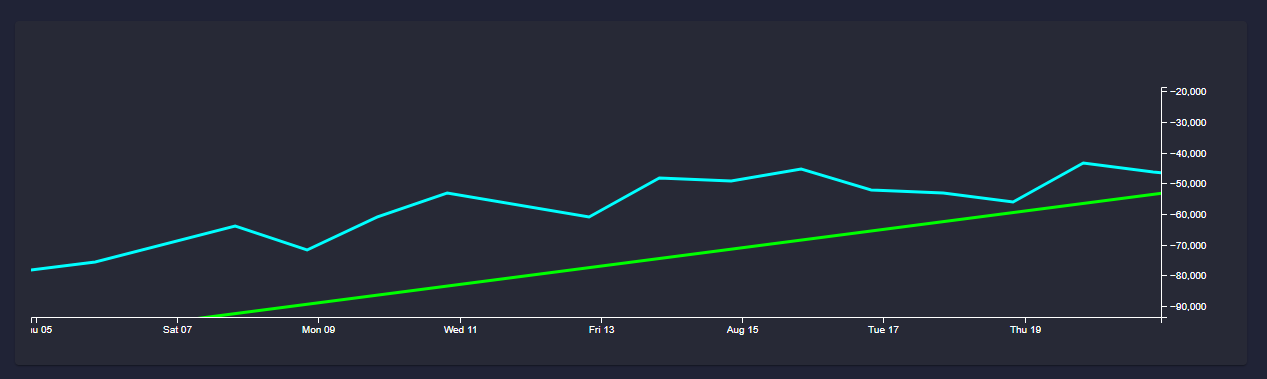
The Datamine Network development team has successfully upgraded the platform's custom trend charts with advanced panning and zooming capabilities. Inspired by TradingView's intuitive design, these interactive controls allow users to navigate ecosystem data more dynamically. Additionally, developers resolved chart clipping issues to ensure clean, precise visualizations of all on-chain analytics.
Future Trend Mapping and Bar Charts
Several milestones are scheduled for completion to enhance the platform’s front-end capabilities prior to the upcoming launch:
- Axis Dragging: Users will soon be able to scale the X and Y axes dynamically by dragging them.
- Bar Chart Conversion: The standard line charts will be converted into bar charts to display dense transactional and inflation data more effectively.
- Data Feed Updates: The underlying data architecture is being updated to support the new bar format natively.
- Trend Drawing: Future updates will introduce tools to draw trend projections directly onto the charts.
These dashboard updates ensure the community has access to transparent, real-time analytics for DAM, FLUX, and LOCK without relying on centralized interfaces.
Hey guys,
Today I've replicated the panning and zooming for the trend chart which will function like Trading View as I really like this set of controls. I've also fixed up the clipping for the chart.
There is one set of controls functionality to copy which is ability to scale X/Y axis by dragging them which I am to finish tomorrow.
I also need to convert line chart into bar chart which would be a good milestone for Tomorrow.
After that I will have to update the data feed to use the new bar data format. This would take us right into the last feature which is to draw trends in the future.
Overall it's quite a packed week and I want to finish this set of core features before launch, but I'll keep you guys updated. 🔥
Frequently Asked Questions
What new chart controls are available on the Datamine dashboard?
The dashboard now features panning and zooming controls modeled after TradingView, along with a fix for chart clipping issues.
What is the next phase of development for these charts?
The developer is adding drag-to-scale X/Y axes, transforming line charts into bar charts, updating the data feeds, and introducing future trend drawing.
Why are custom charts and metrics so important to the Datamine Network?
Since Datamine is fully decentralized and lacks a central company, clear and verifiable real-time analytics are essential for users to monitor supply inflation, burn rates, and liquidity for tokens like DAM, FLUX, and LOCK.
 · hodlforjesus · #dev-updates