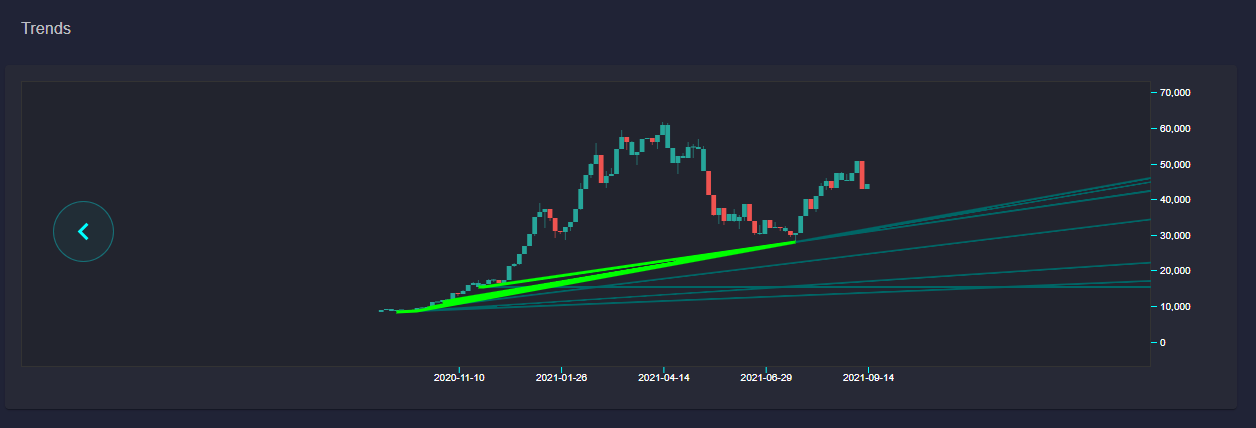
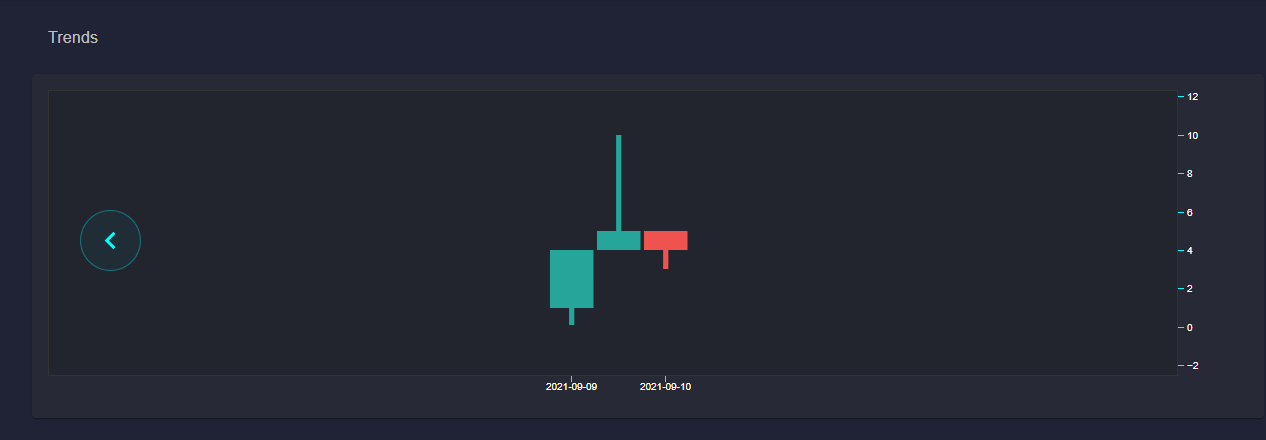
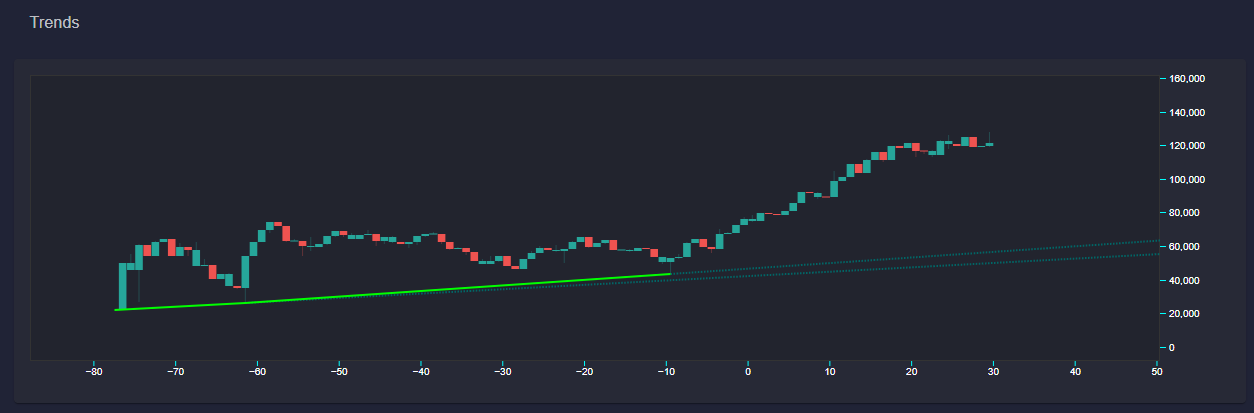
Spent the day updating a bit of UX on the frontend. Now you can "Drag" the Y scale just like on tradingview chart.
This will be very helpful when zooming in closer to the trends as a long time frame is hard to see sometimes.
Now that we have both pan, X and Y zooms working I want to spend a couple of days working on interactive trends filtering.
With charts like Bitcoin there are simply too many small trends and the user will want to customize the granularity of what trends they want to see.
I am taking my time with this project as it requires just the right amount of UI & UX to be useful for everyday usage. So stay tuned there is lots more coming to Trends! 🔥
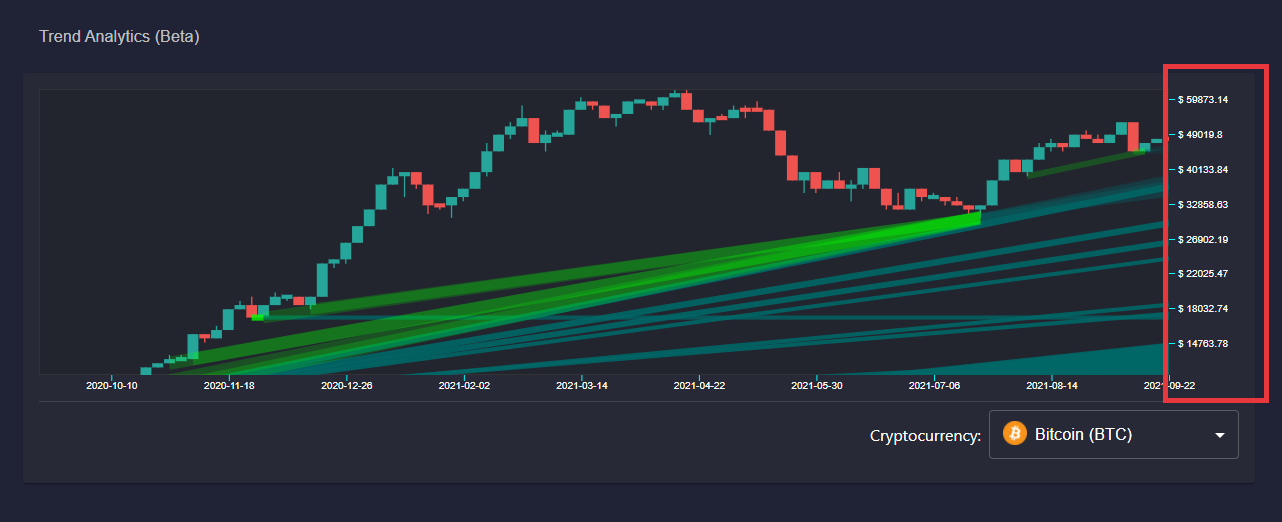
Super excited to show my progress on the new trend engine. Accomplished much more than I was expecting on the weekend, now we have the entire engine functioning and I've even tried it against BTC data to show what to expect.
The new engine is blazing fast and it can detect even more trends that would previously be removed. Additionally I've spent a lot of time working on all the edge cases to get the engine to behave exactly as expected.
Lots of reworking and brainstorming but we finally have it! Over the next couple days I will clean up a few remaining tasks and add the downtrends before release.
Super excited we took this detour because now we can go into the future knowing the trend engine can handle the expected amounts of data we'll be throwing at it. 🔥
Got the new candle system working on the frontend. This is a much more robust system with more caching built-in to get more performance that is required for the new trends.
Now that we can more accurately control candle values I can focus on the new complex logic of extracting trends from candle data.
Hoping to get another screenshot of new trends in action this Saturday. Keep in mind this is work in progress, but the extra time spent in this area will ensure data accuracy in the end. 🔥
I've decided to take a different direction on how to accomplish the new trend detection. For this I will need a much more robust and precise data point.
With the new data point we can also now handle "non-time based trend sequences". This means our tech will also work for non-linear scale .
This means we can apply this to non-time based patterns such as trends for minting/burning irregardless of time.
On top of this we are getting an insane high performance trend engine from scratch to ensure all the special cases are handled as expected.
Today, I've laid out the foundation for this new system. Tomorrow I plan to start showing some data for this on the frontend. A slight detour but as always worth the extra wait as the results will be amazing! 🔥
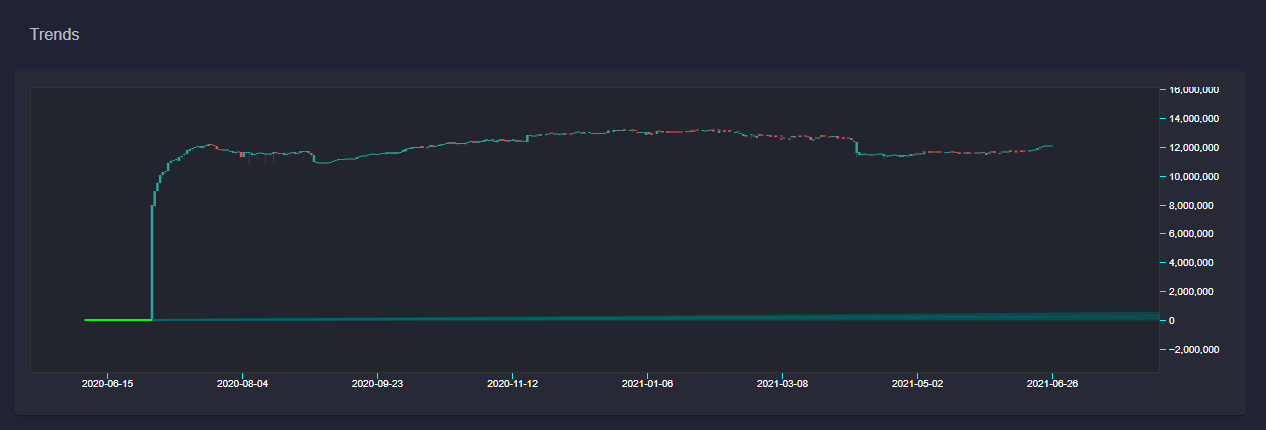
Today I've added a new data point for the trends engine: Total DAM powering mints.
Our trend engine supports any data point, not just USD prices.
Tomorrow I will spend some time upgrading the trend engine so it can find some more trends that are currently missing (due to the shape of the chart). The new trend engine works slightly differently but should result in more trends being extracted from any data.
Be sure to follow the trend updates as they reveal potential futures of any data point. (And we can prove this with on-chain data) 🔥
Was working on something else for a couple of days but finally back to Trends. Was working on adding a "Load More" button for trends.
I first added it as a button next to the bars, but as you would scale the bars it would also scale the button...
Then I added it at a fixed position on the chart, but it would overlap the bars which I didn't like. I was also not a fan of it showing up even when there are already all bars visible.
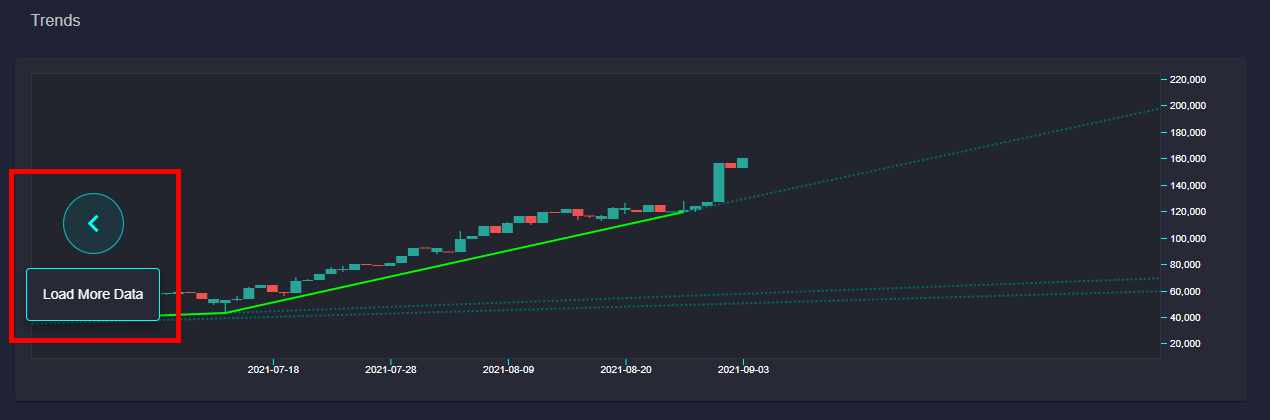
So I decided to spend the next couple of hours doing some funky math to display it when the there are only a few bars left. (Attached a picture of what this looks like).
Now that I had this math I thought it would be much cooler to automatically load the bars as you scroll for "infinite scrolling" just like data. This would allow you to see all the data without having to load more, it just shows up as you use it for a seamless experience.
To me utilizing our real-time analytics to solve small UX experiences like this is what makes the system so awesome. There is still more updates for this chart but I'll keep you guys updated of my progress. 🔥
Wanted to update you on what I've been up to recently. There are still a couple of crucial changes I want to add before launching the real-time trends.
One is a button to load more candles as right now you have to scroll down to get more candles which might be confusing.
Uptrends are added but I still need to show downtrends as well. In the future there will be a toolbar so you can customize look & feel of the chart.
We also need to add a small disclaimer that this is an experimental feature and this data should only be used for informational purposes.
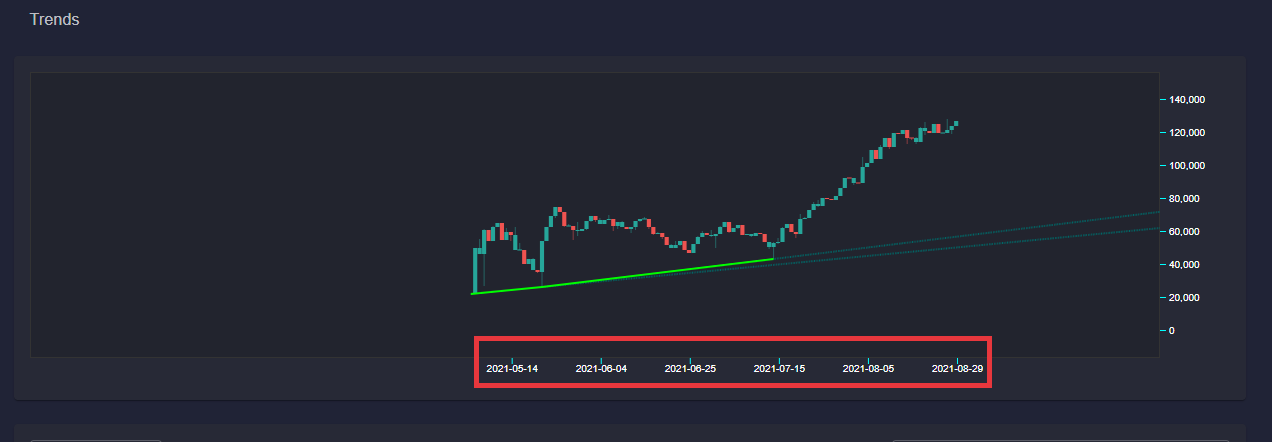
I've been able to also add dates into the mix (Right now formatting is not great on these labels but it's functional for launch). This was super tricky and took me about 2 days to iron out and get it to look as I wanted.
There is still lots to come so be sure to follow the updates. 🔥
Wanted to show you another set of updates to the upcoming Trends.
Things are looking a lot better, I've been able to address a lot of small outstanding tasks Today. One of the most important pieces that I've added Today is the ability to hide trends that are still to early.
As you can see from the screenshot only a "mature" trend will show. Right now this is any trend that is at least 4 days old, but I want to make this number customizable on the frontend in the future.
Another big change Today was that the trends are now much more accurate when multiple actions happen in the same Ethereum block.
Be sure to follow the updates, there is still so much to be added to this new feature. 🔥
Was going to do the bar value mappings today but instead spent time working on a few pieces of UI/UX.
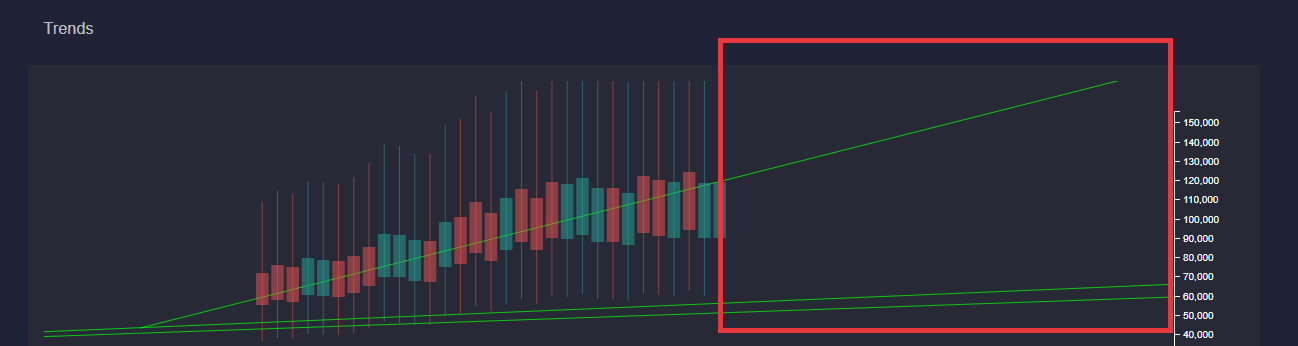
The most important of which is the trendlines are now finally drawn into the future!
This was super tricky to do and I am glad it's finally done as this is basically the core functionality that I couldn't find in charting libraries.
Tomorrow I plan to fix up the bars to properly reflect the on-chain data. Things are starting to come together, a couple more days and you will be able to play around with this. 🔥

 · hodlforjesus · #dev-updates