
Infinite Scrolling Enhances Datamine Real-Time Trend Analytics
💡 AI Article Summary
Optimizing Real-Time Trend Analytics
The Datamine Network is continuously refining its decentralized analytics dashboard to deliver a world-class user experience. In the latest update, the dashboard's "Trends" chart has been overhauled, replacing clunky manual pagination options with a high-performance infinite scrolling mechanism. This change streamlines how users interact with historical on-chain metrics.
Solving UI Layout Challenges with Precision
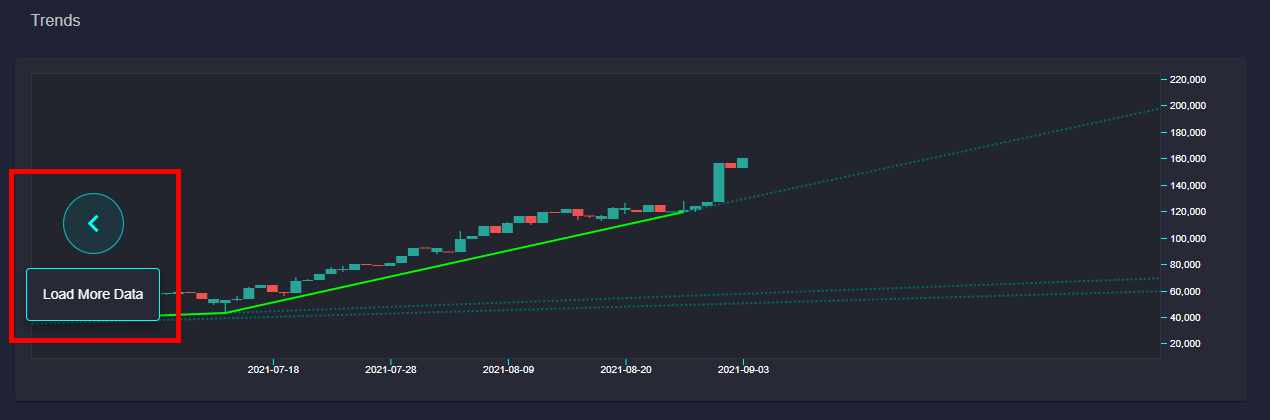
Initially, the developer introduced a "Load More" button to fetch older data. However, scaling the chart dynamically caused the button to stretch or overlap the trend bars. To resolve this, the development team implemented layout mathematics that detect when a user is approaching the end of the visible chart. This calculation now automatically triggers data fetches, creating a fluid, endless-scroll experience.
Seamless Access to Decentralized Metrics
With over five years of immutable, real-time data—including token burn rates, market efficiency percentages, and validator activity—having an optimized interface is essential. Transitioning to infinite scrolling ensures that users exploring trend patterns for DAM, FLUX, and LOCK can easily navigate massive amounts of data without layout interruptions.
Hey guys,
Was working on something else for a couple of days but finally back to Trends. Was working on adding a "Load More" button for trends.
I first added it as a button next to the bars, but as you would scale the bars it would also scale the button...
Then I added it at a fixed position on the chart, but it would overlap the bars which I didn't like. I was also not a fan of it showing up even when there are already all bars visible.
So I decided to spend the next couple of hours doing some funky math to display it when the there are only a few bars left. (Attached a picture of what this looks like).
Now that I had this math I thought it would be much cooler to automatically load the bars as you scroll for "infinite scrolling" just like data. This would allow you to see all the data without having to load more, it just shows up as you use it for a seamless experience.
To me utilizing our real-time analytics to solve small UX experiences like this is what makes the system so awesome. There is still more updates for this chart but I'll keep you guys updated of my progress. 🔥
Frequently Asked Questions
What is the new infinite scrolling update on the Datamine dashboard?
The infinite scrolling update automatically loads older historical data on the Trends chart as the user scrolls, eliminating the need for a manual "Load More" button.
Why did the developer replace the "Load More" button?
The manual button caused visual bugs, such as stretching awkwardly when the chart scaled or overlapping data bars. Custom layout math resolved these visual scaling issues.
How does this update improve the analysis of Datamine tokens?
It allows users to seamlessly scan five years of historical, real-time on-chain data for tokens like DAM, FLUX, and LOCK without experiencing dashboard lag or formatting issues.
 · hodlforjesus · #dev-updates