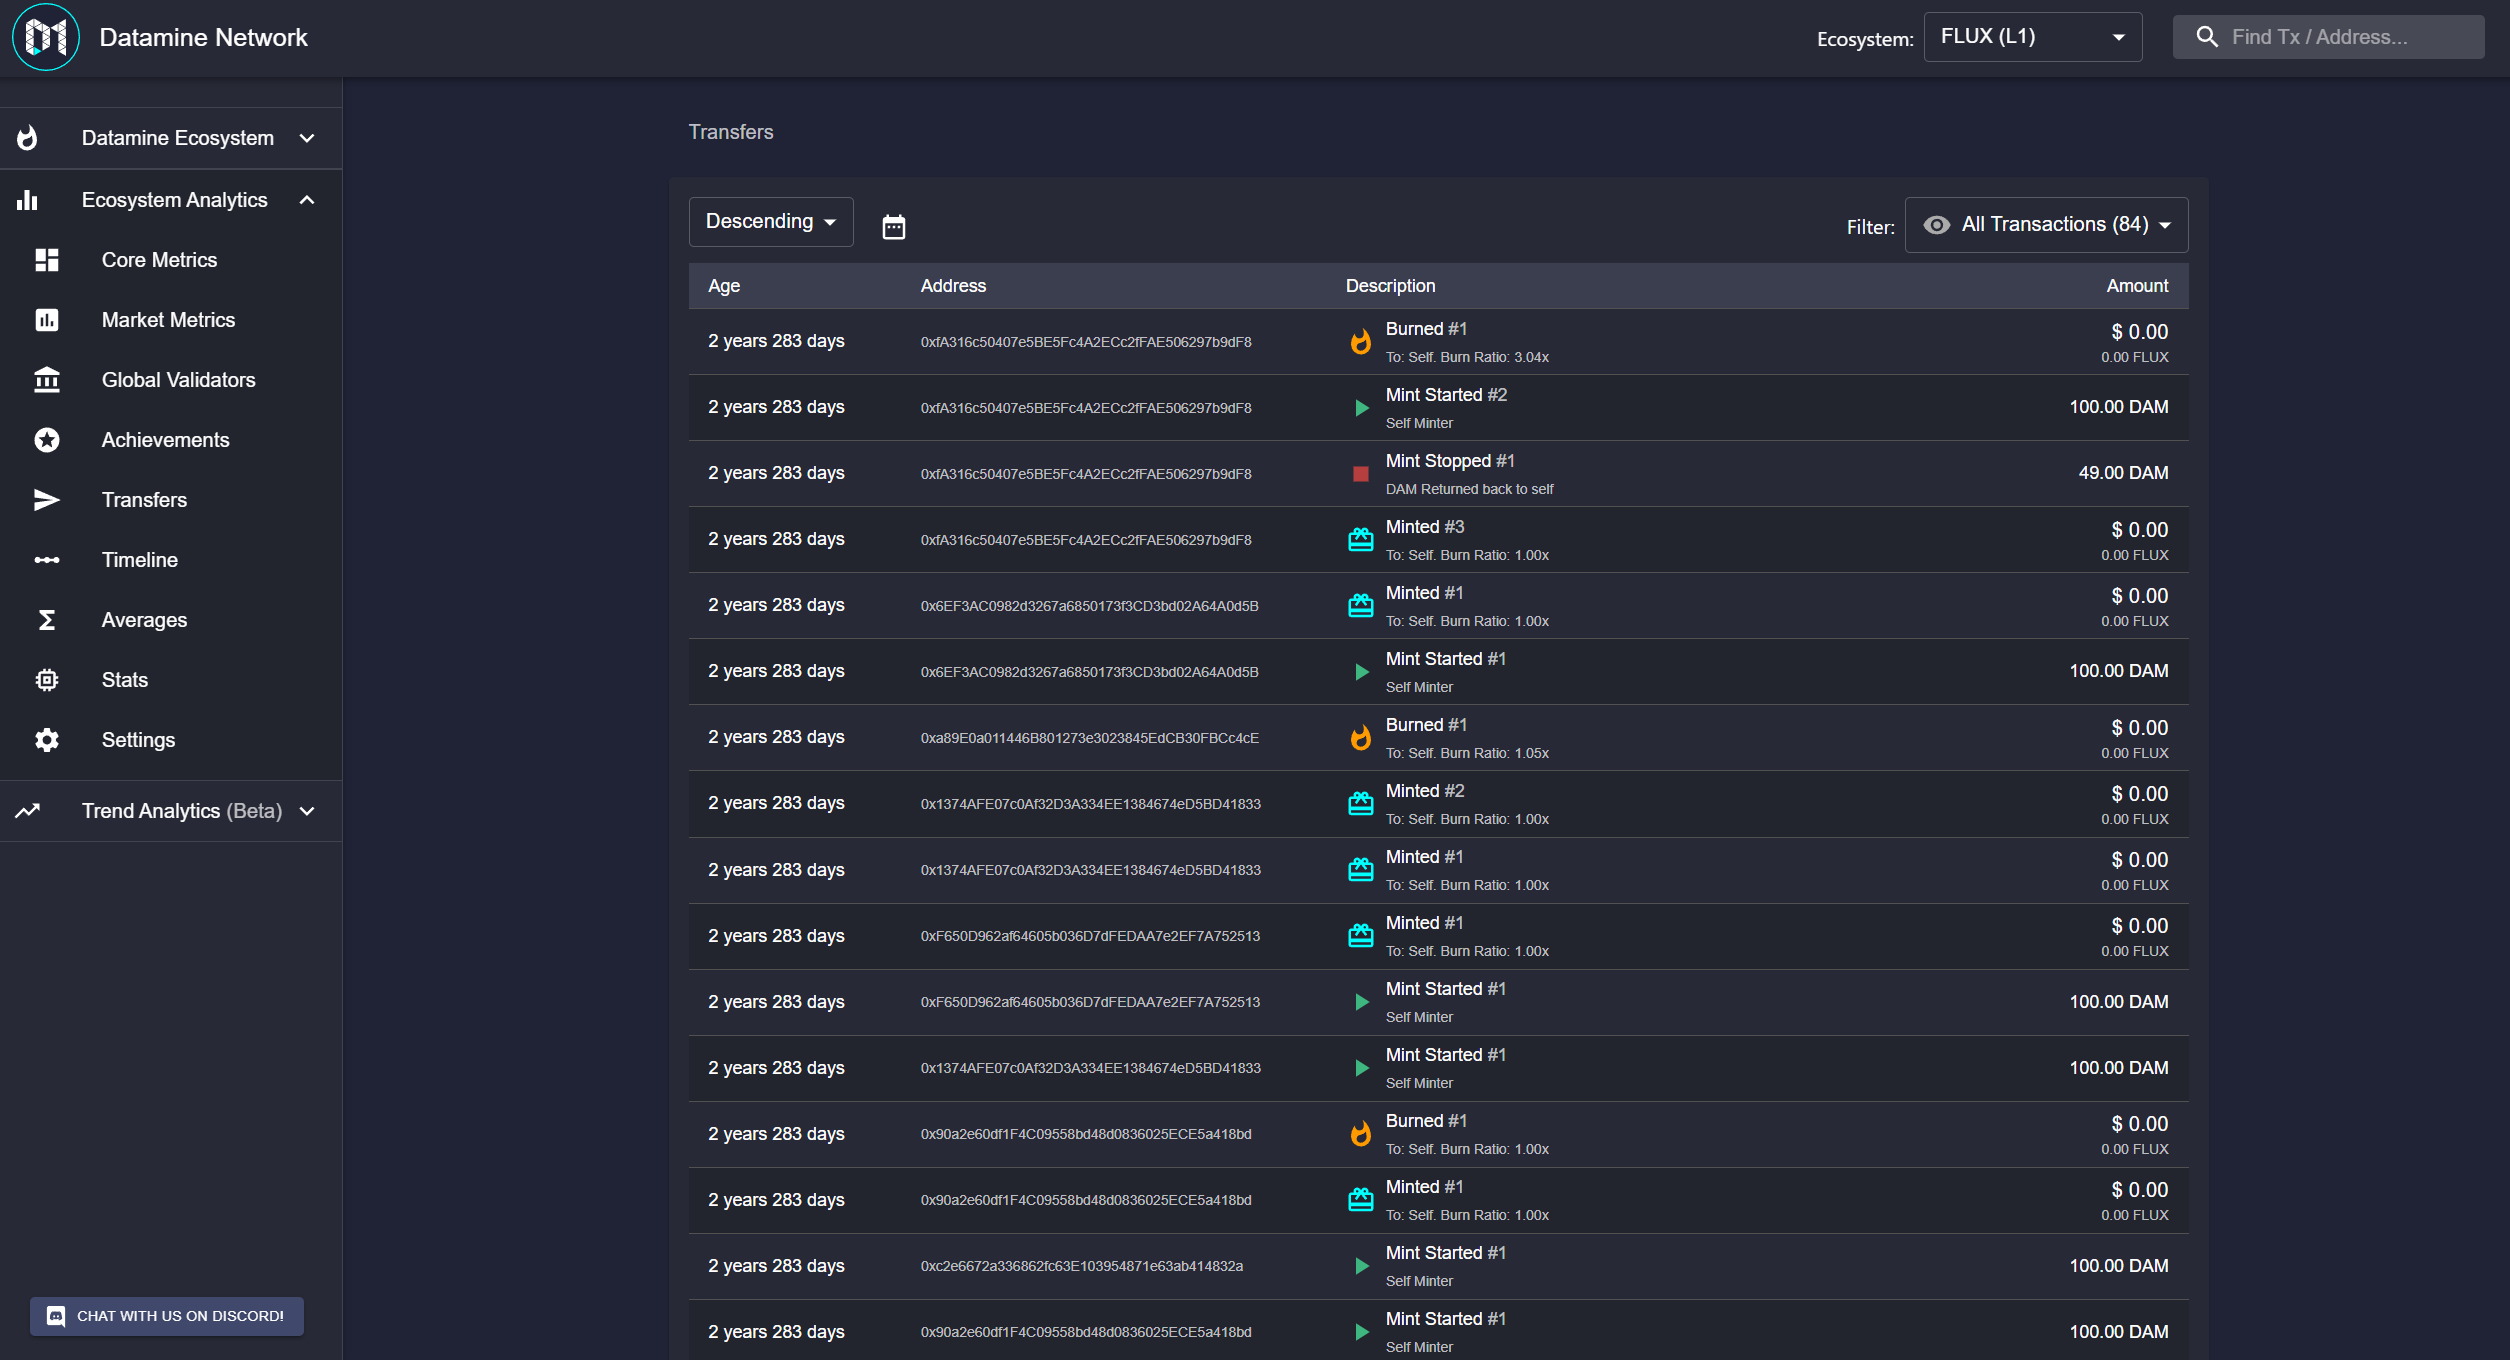
Hey guys this is one of the first forks we've been working with for the new "ArbiFLUX Launchpad" project
It's a different take on our original contract with 100x burn multiplier (instead of 10x). As you've seen I've been making a number of GitHub updates to our new open source dashboard to support their new requirements.
The best part is that they use ArbiFLUX to generate BRAIN tokens. Lock-in ArbiFLUX, generate BRAIN! This is what ArbiFLUX Launchpad is all about, extending ArbiFLUX functionality to give fair launch options for new tokens!
We'll be working closely with Brainlet Finance to ensure the dashboard functions perfectly for them. We'll also be adding some new documentation for how you can launch your own token on "ArbiFLUX Launchpad" and create a customized ruleset that works for you! 🔥
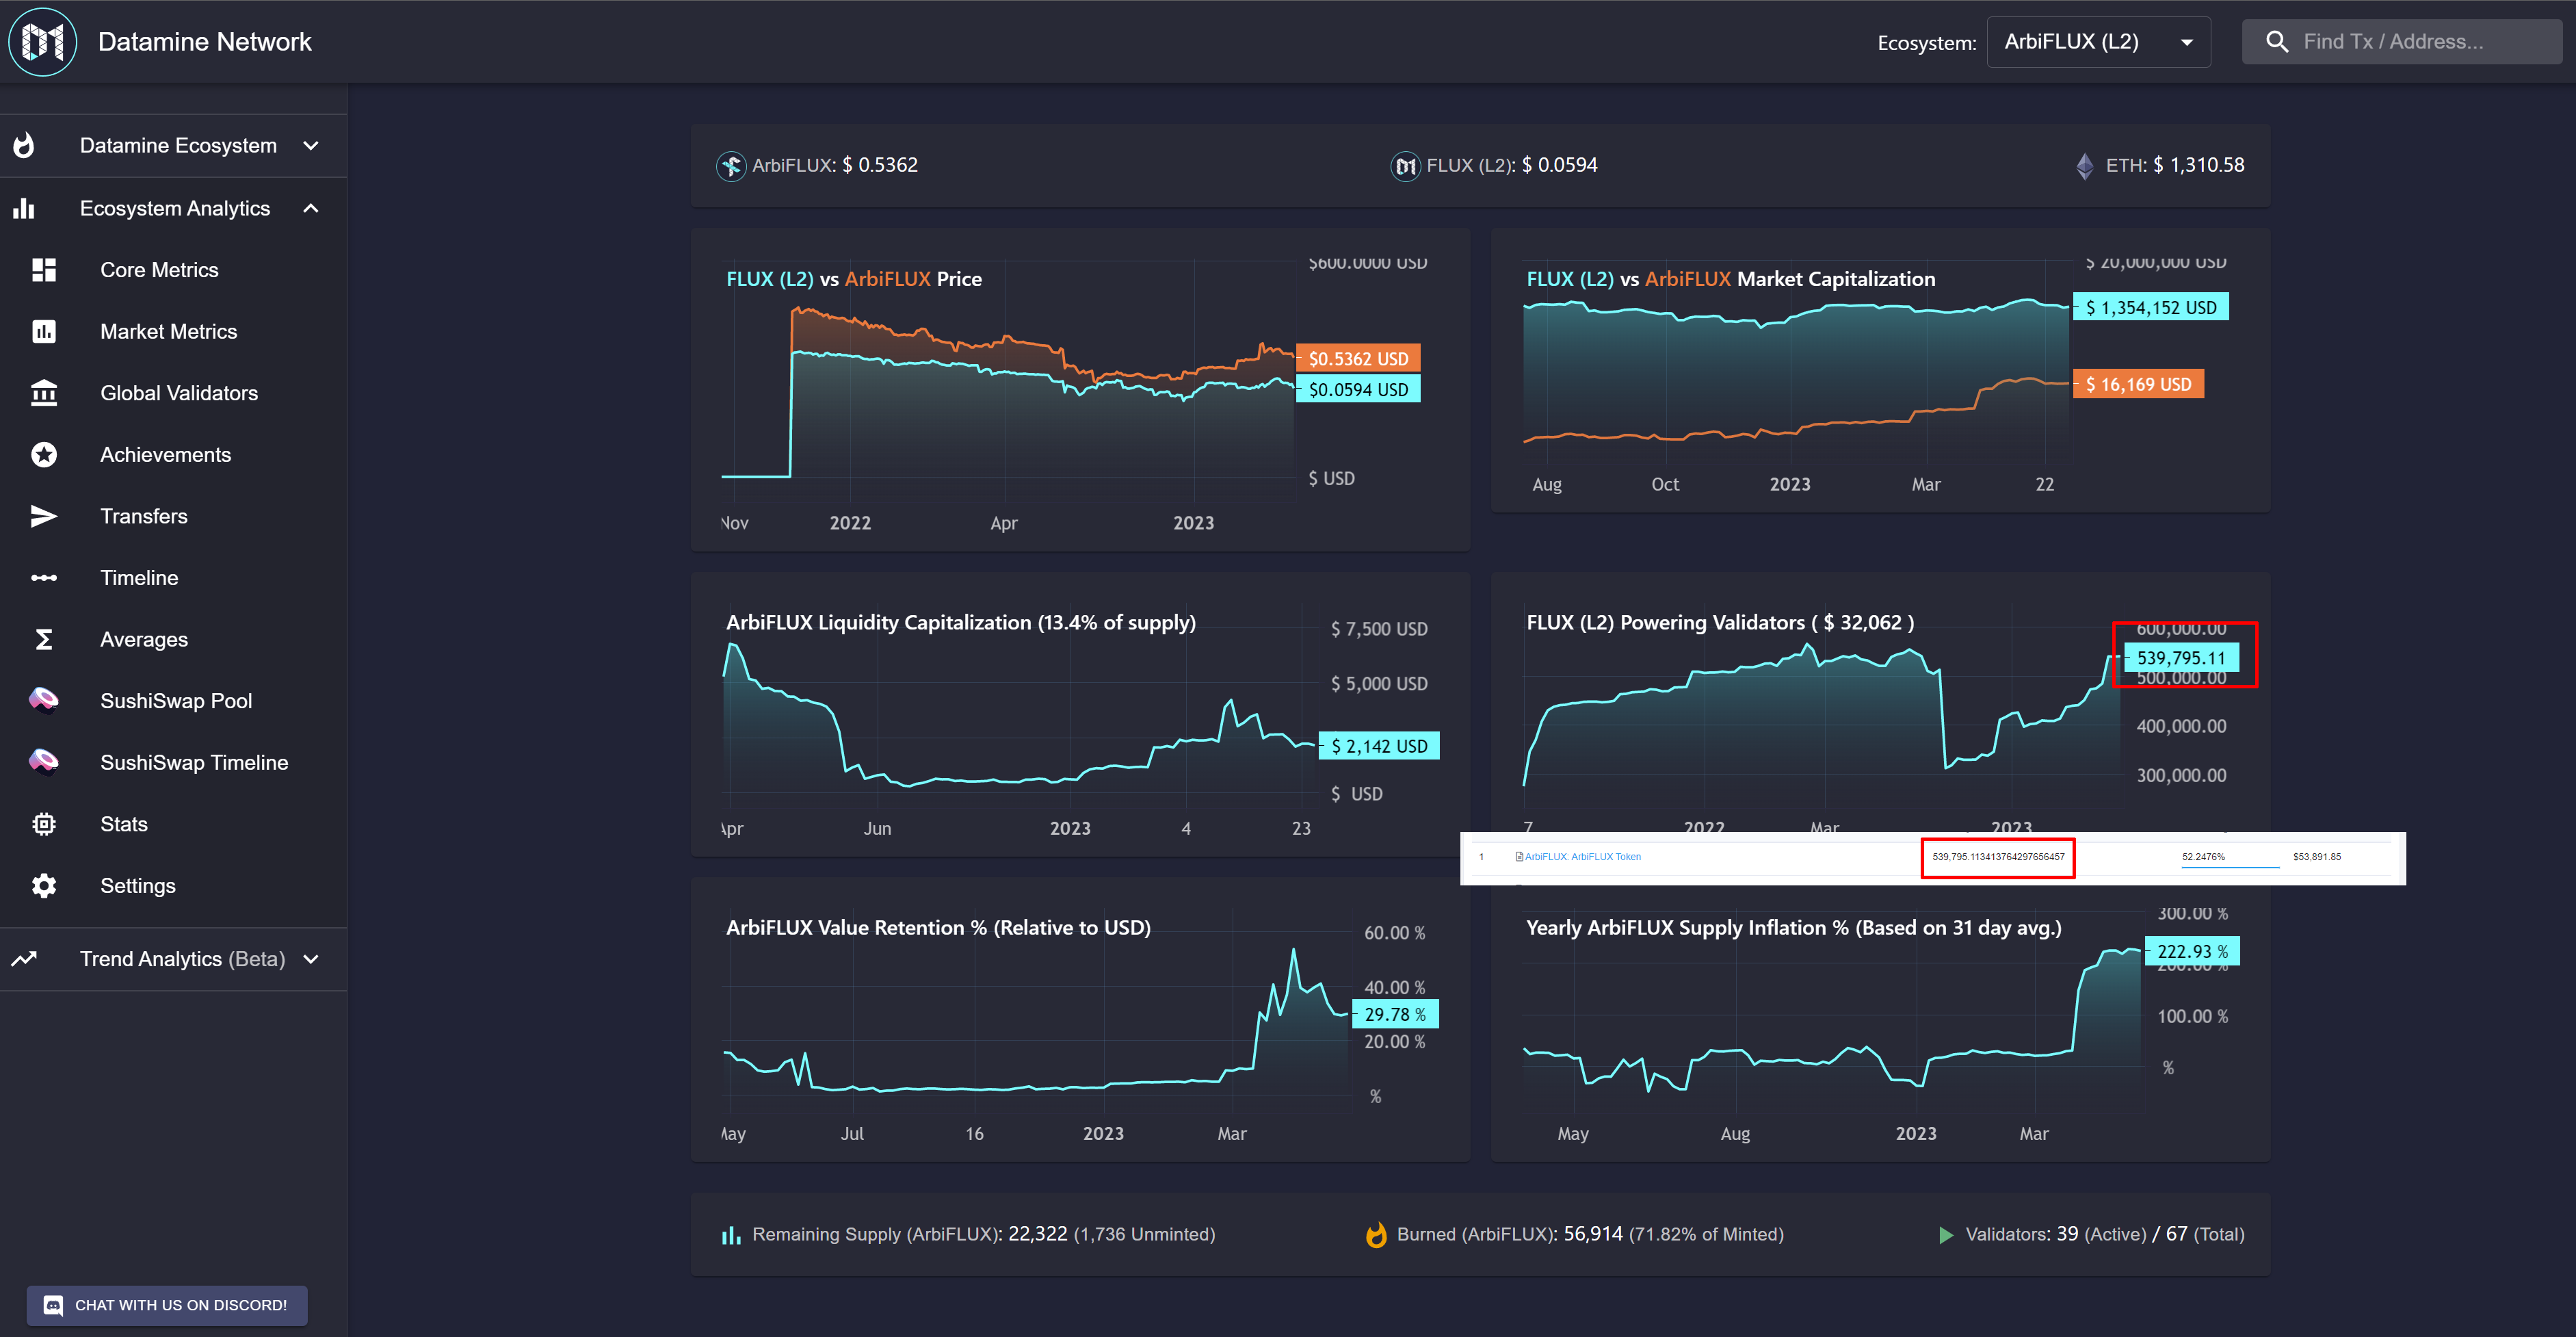
I've just finished a complete resync of analytics for FLUX + ArbiFLUX ecosystem. Using a completely new syncing process for on-chain data I was able to get 10x smaller database size for exact same amount of data!
The new sync is also accurate for L2 data (as you can see from the screenshot). Overall this should give us a lot more accuracy going forward and also give us some more room to scale as the database size is greatly reduced!
This was a very important project for us as accuracy of analytics is our top priority.
Aiming to get this deployed to production in the coming days. Meaning we'll be wiping all the stored data and re-syncing everything (which should take roughly 30 minutes for all ecosystems🔥 )
Hey guys wanted to give you a quick update regarding the new approach for syncing data from Ethereum. First of all we'll do a complete wipe of all existing data and re-sync everything for both L1 and Arbitrum L2. This includes all projects including FLUX, ArbiFLUX and Farmland.
The new approach to syncing data is faster, more accurate and takes less resources. Overall it's a win-win. I've had to spend a lot of time removing and reworking a lot of existing code but in the end I got everything to sync.
I'll be going over the data tomorrow to ensure everything is accurate but we should be putting up an update soon. This means L2 data will be more accurate and we'll be syncing L2 data more frequently. 🔥
Hey guys, I've had to disable automatic updates for ArbiFLUX on Arbitrum while The Graph is catching up with the syncing. Seems like it's struggling to catch up for the last few days. So Arbitrium analytics will only update on releases for now until The Graph finishes catching up.
If this is not resolved we'll have to start looking for some alternative graphs for some data we need. (So don't worry, I know ArbiFLUX data is not syncing, I am just waiting for the syncing) 🙏
I've been working on the new customizable widgets for Ecosystem Analytics tab. Just finished the first one (it works with that infinite loading). Next part will be to convert the other 5 widgets.
Then we'll convert top and bottom numbers into customizable widgets.
After that the plan is to convert the "Market Metrics" page into the new customizable widgets. At this point we should have a new release out. At this point the dashboard would function identically to the current version but the market metrics page would get historic infinite data loading.
After that we can start to expose some of the customization for widgets to the frontend. So very soon you'll be able to pick how your dashboard looks, and which charts/data points are of interest to you. 🔥
Wanted to give a quick update on what's coming up next. Right now we're in a good "limbo" state as the FLUX liquidity pool slowly builds up and the burn decay slows down.
You might have seen "Custom Widgets portal" in the announcement that is planned for Datamine Network Pro.
I've decided to work on this feature prior to releasing the Pro version of the platform. There is a lot of data and right now I can't get the views that I want. So the plan is to focus on this feature and get people to try out the Pro version features before the launch.
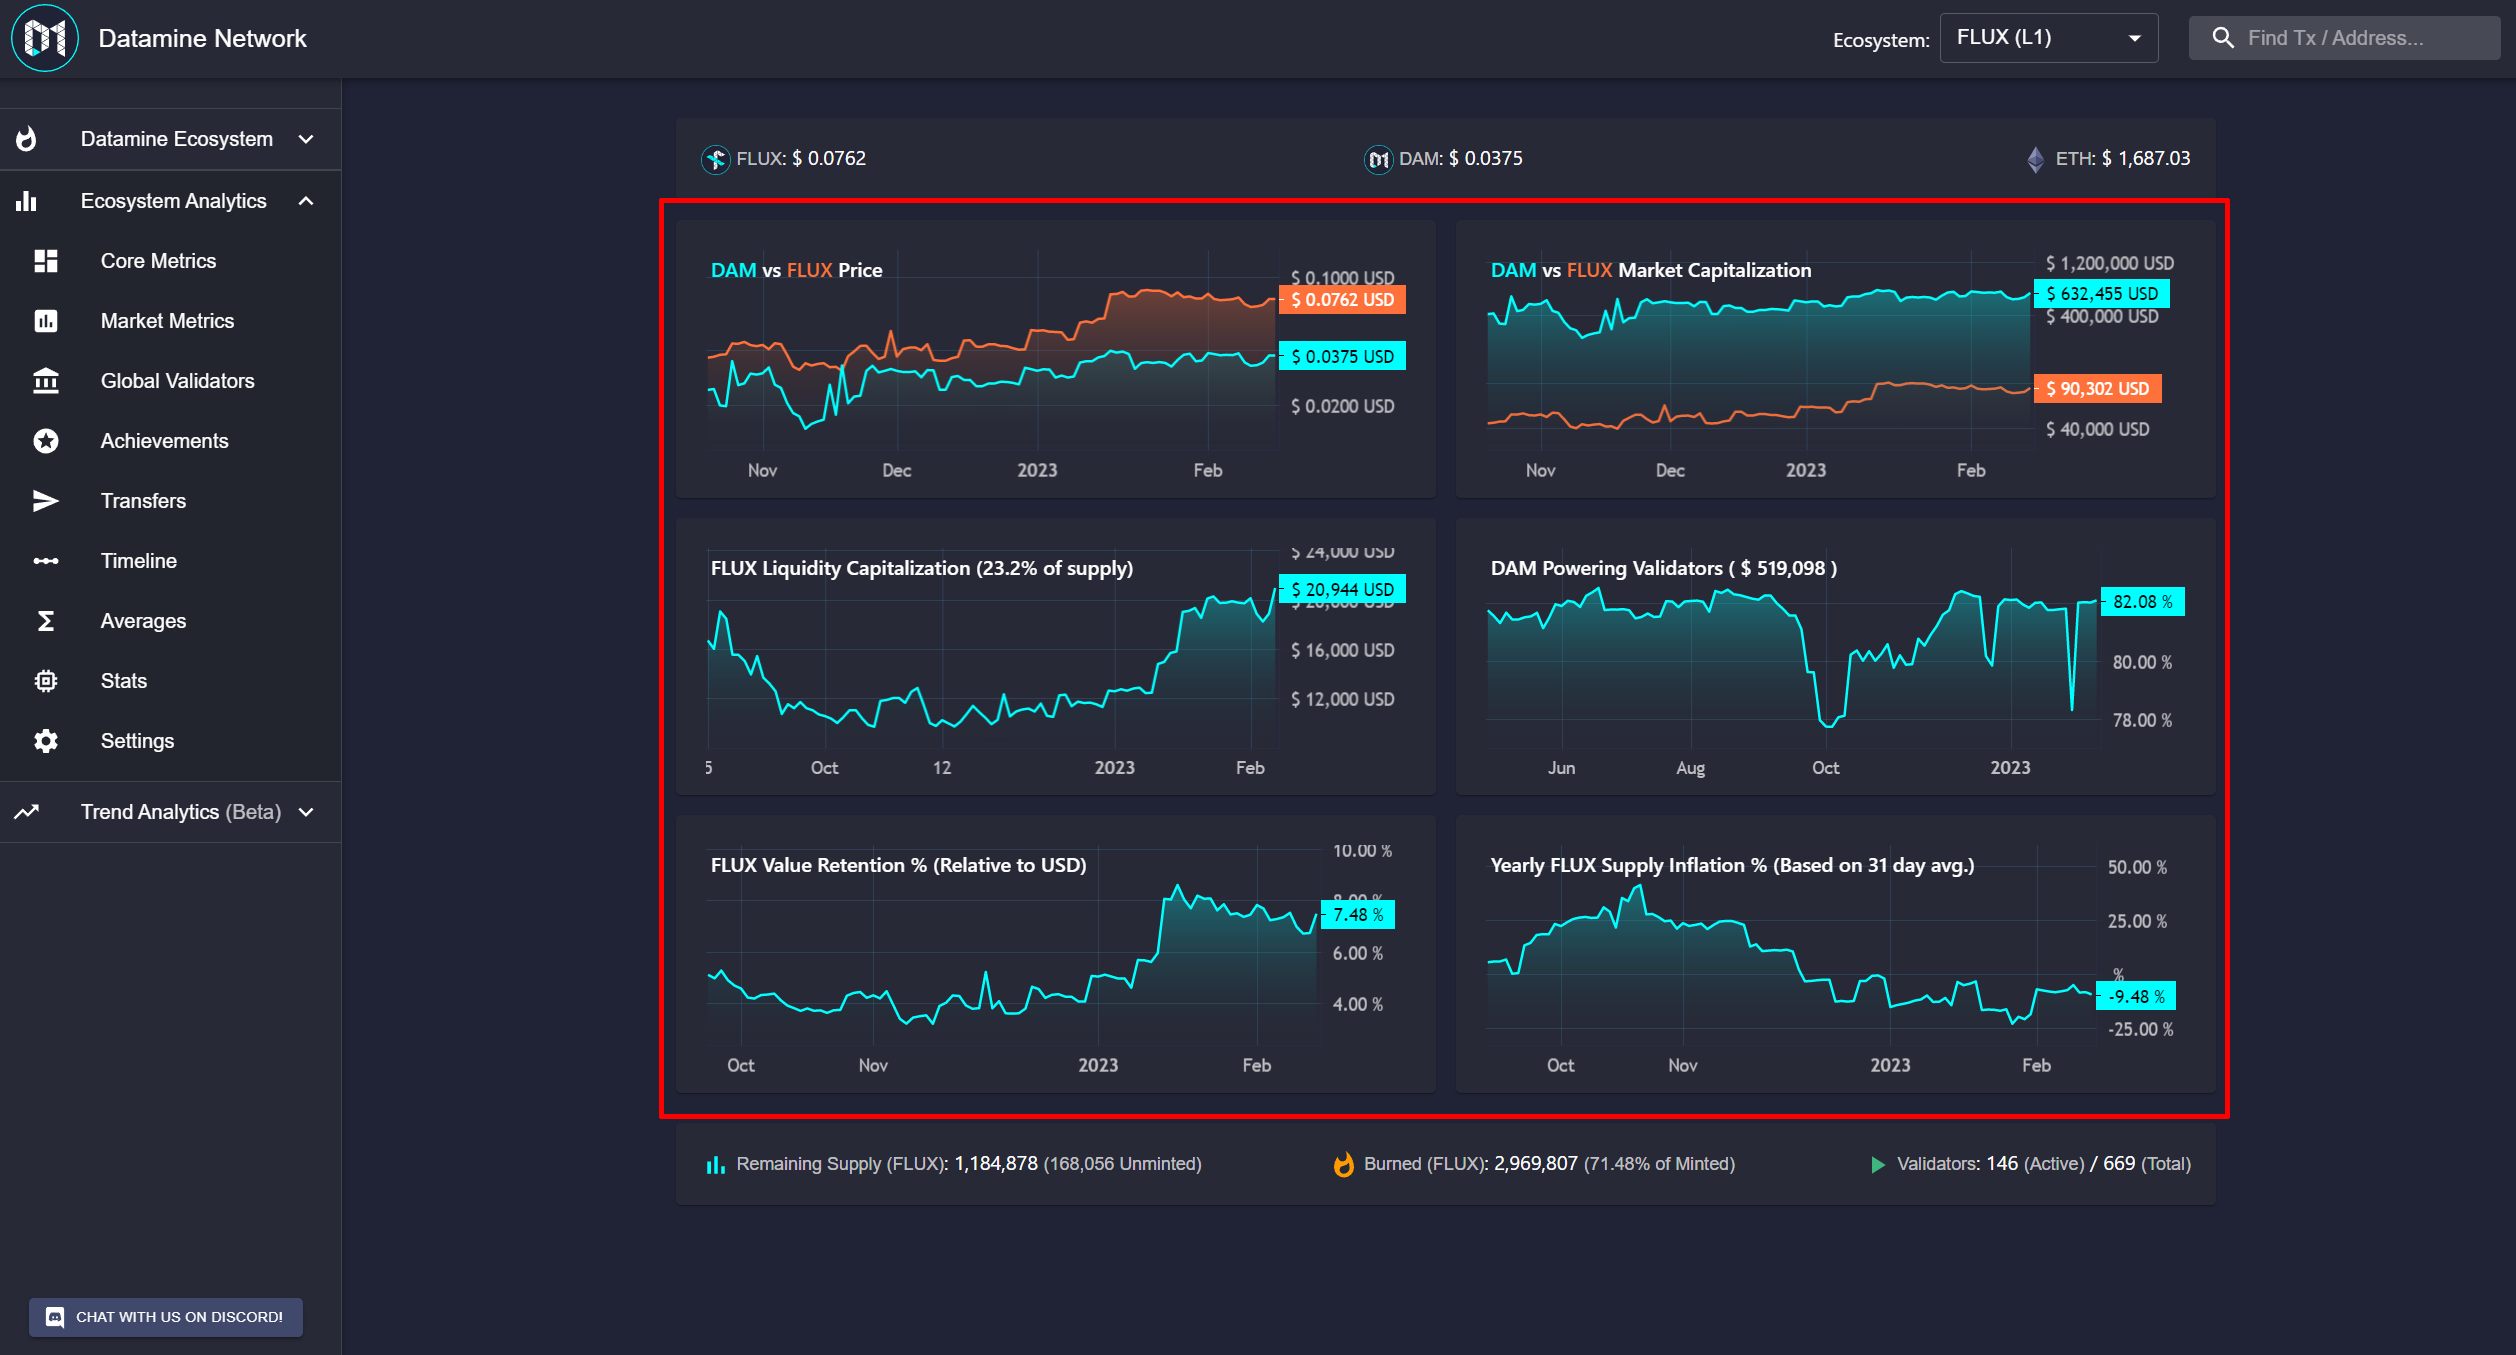
To break up this complex feature we'll start by focusing on these six widgets on the dashboard. The plan is to re-work this piece of the dashboard into six separate real-time widgets.
This will allow us to move onto Phase 2 which is Widget customizability. There is still lots more to come so be sure to stay tuned for this update as you will be able to customize the network to your liking 🙏
Hey guys, Tomorrow we'll see a really cool new feature added to Ecosystem Analytics that I am sure many of you will find very useful.
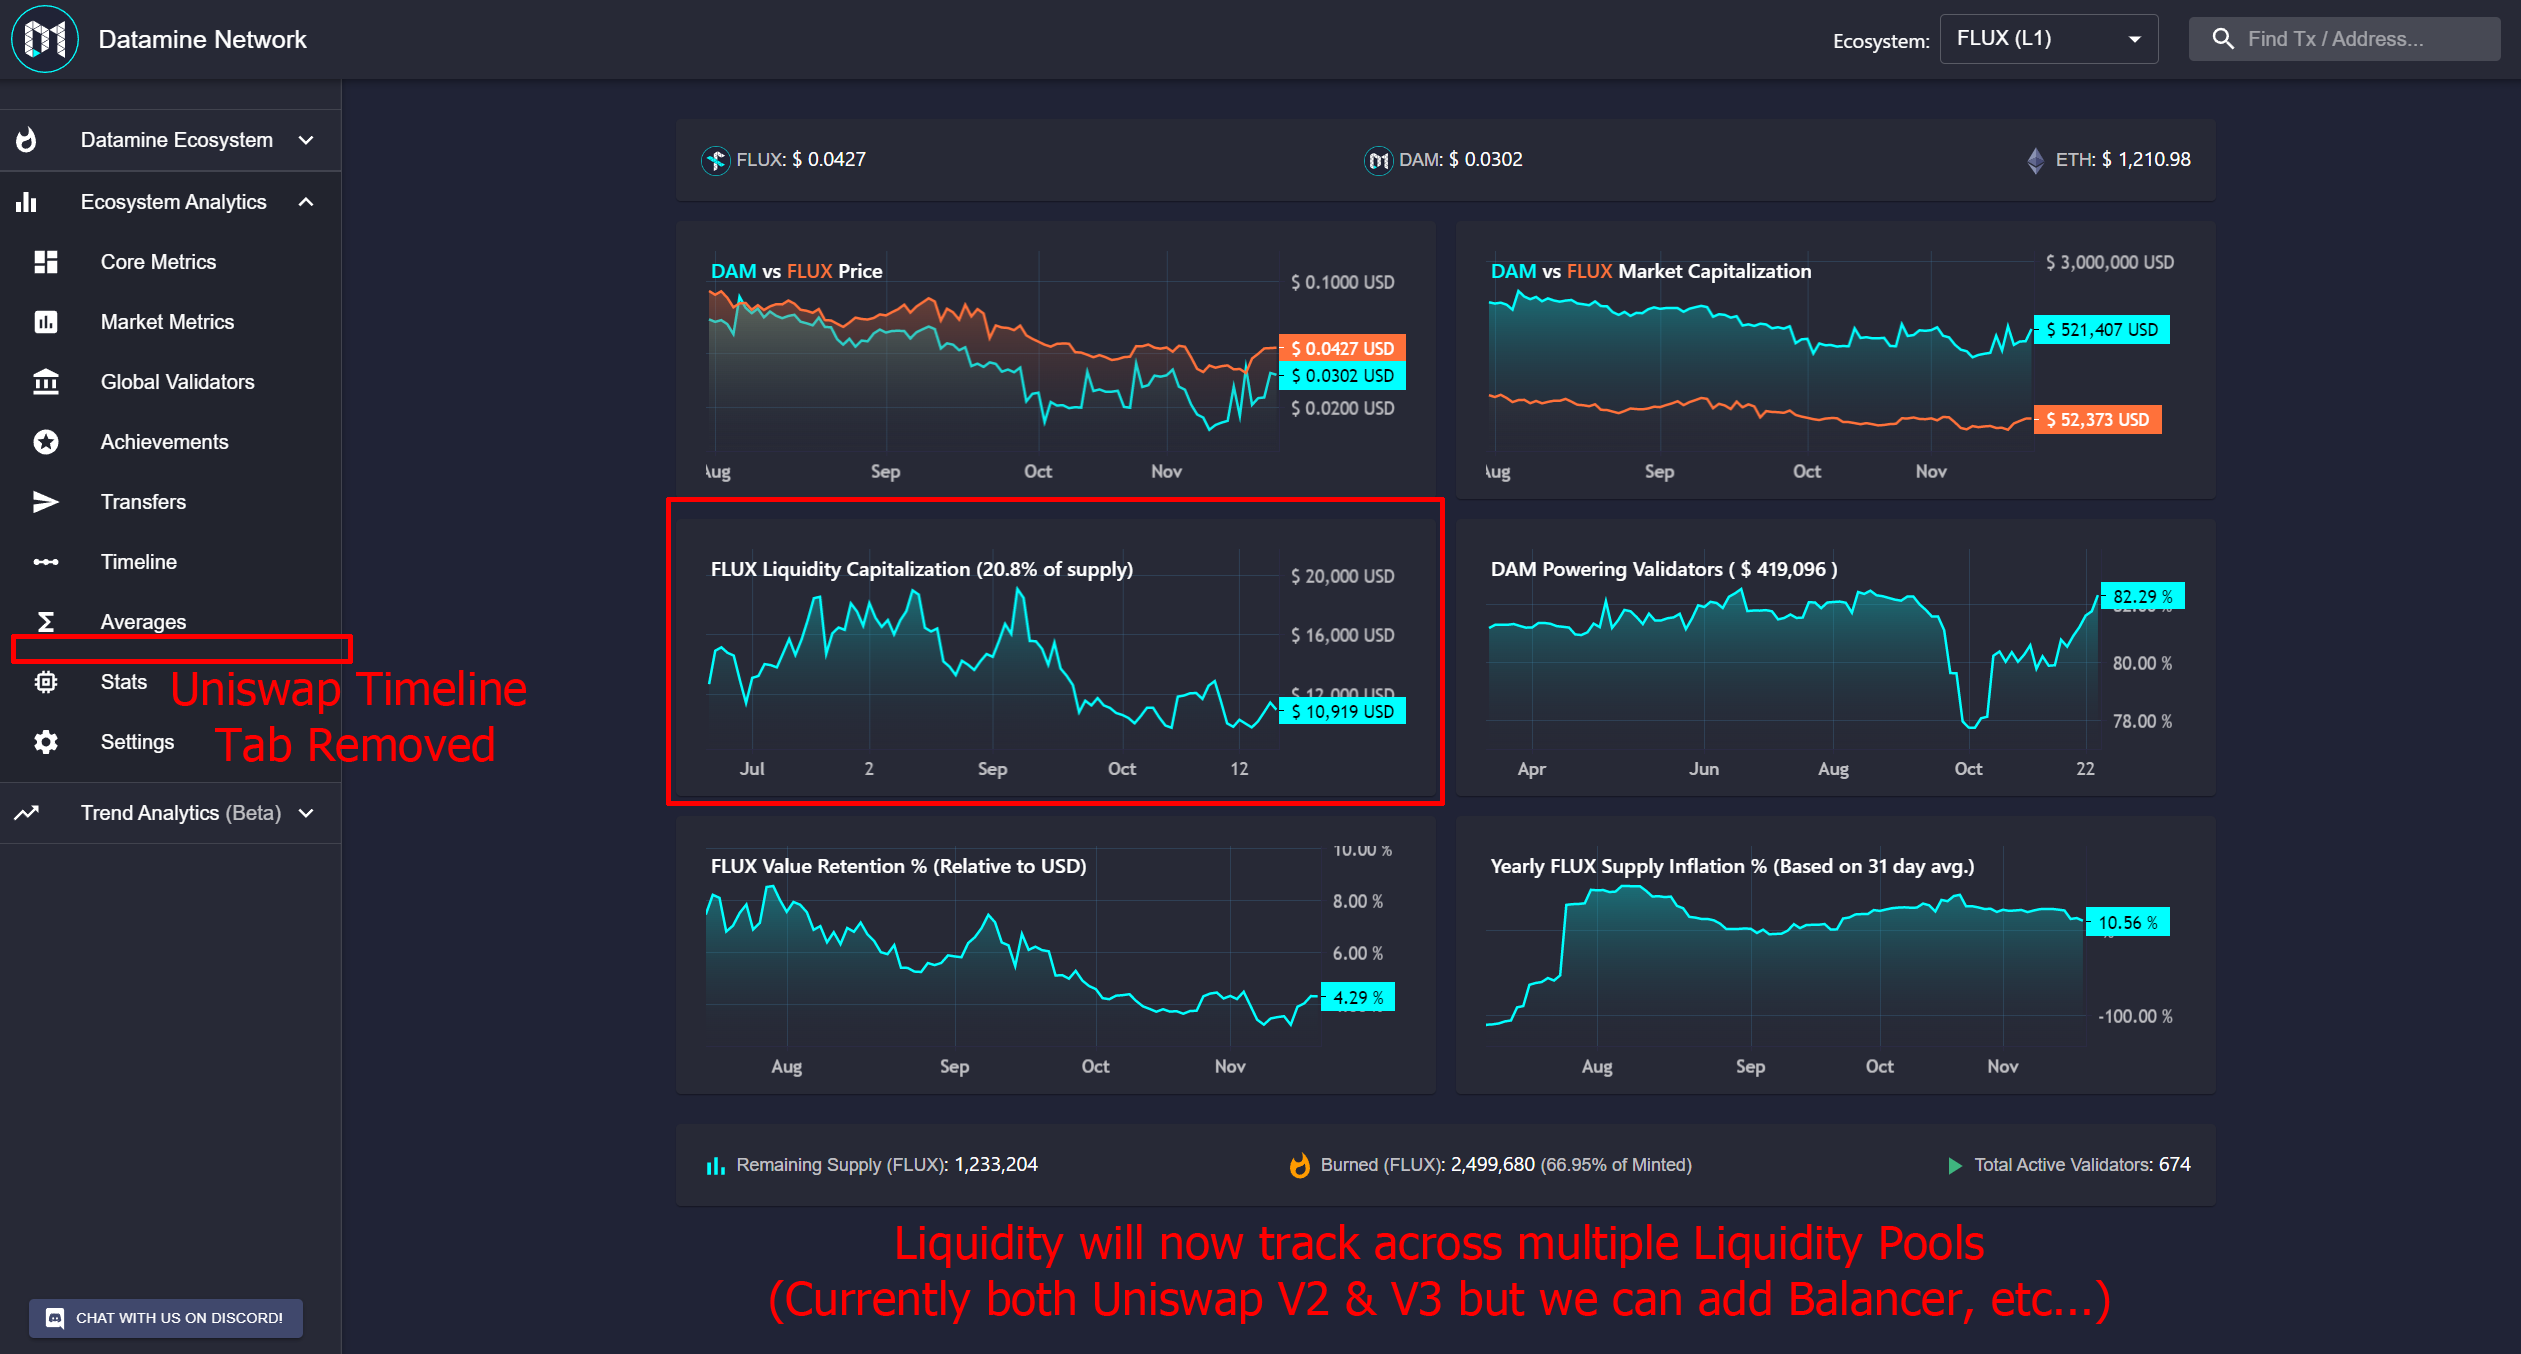
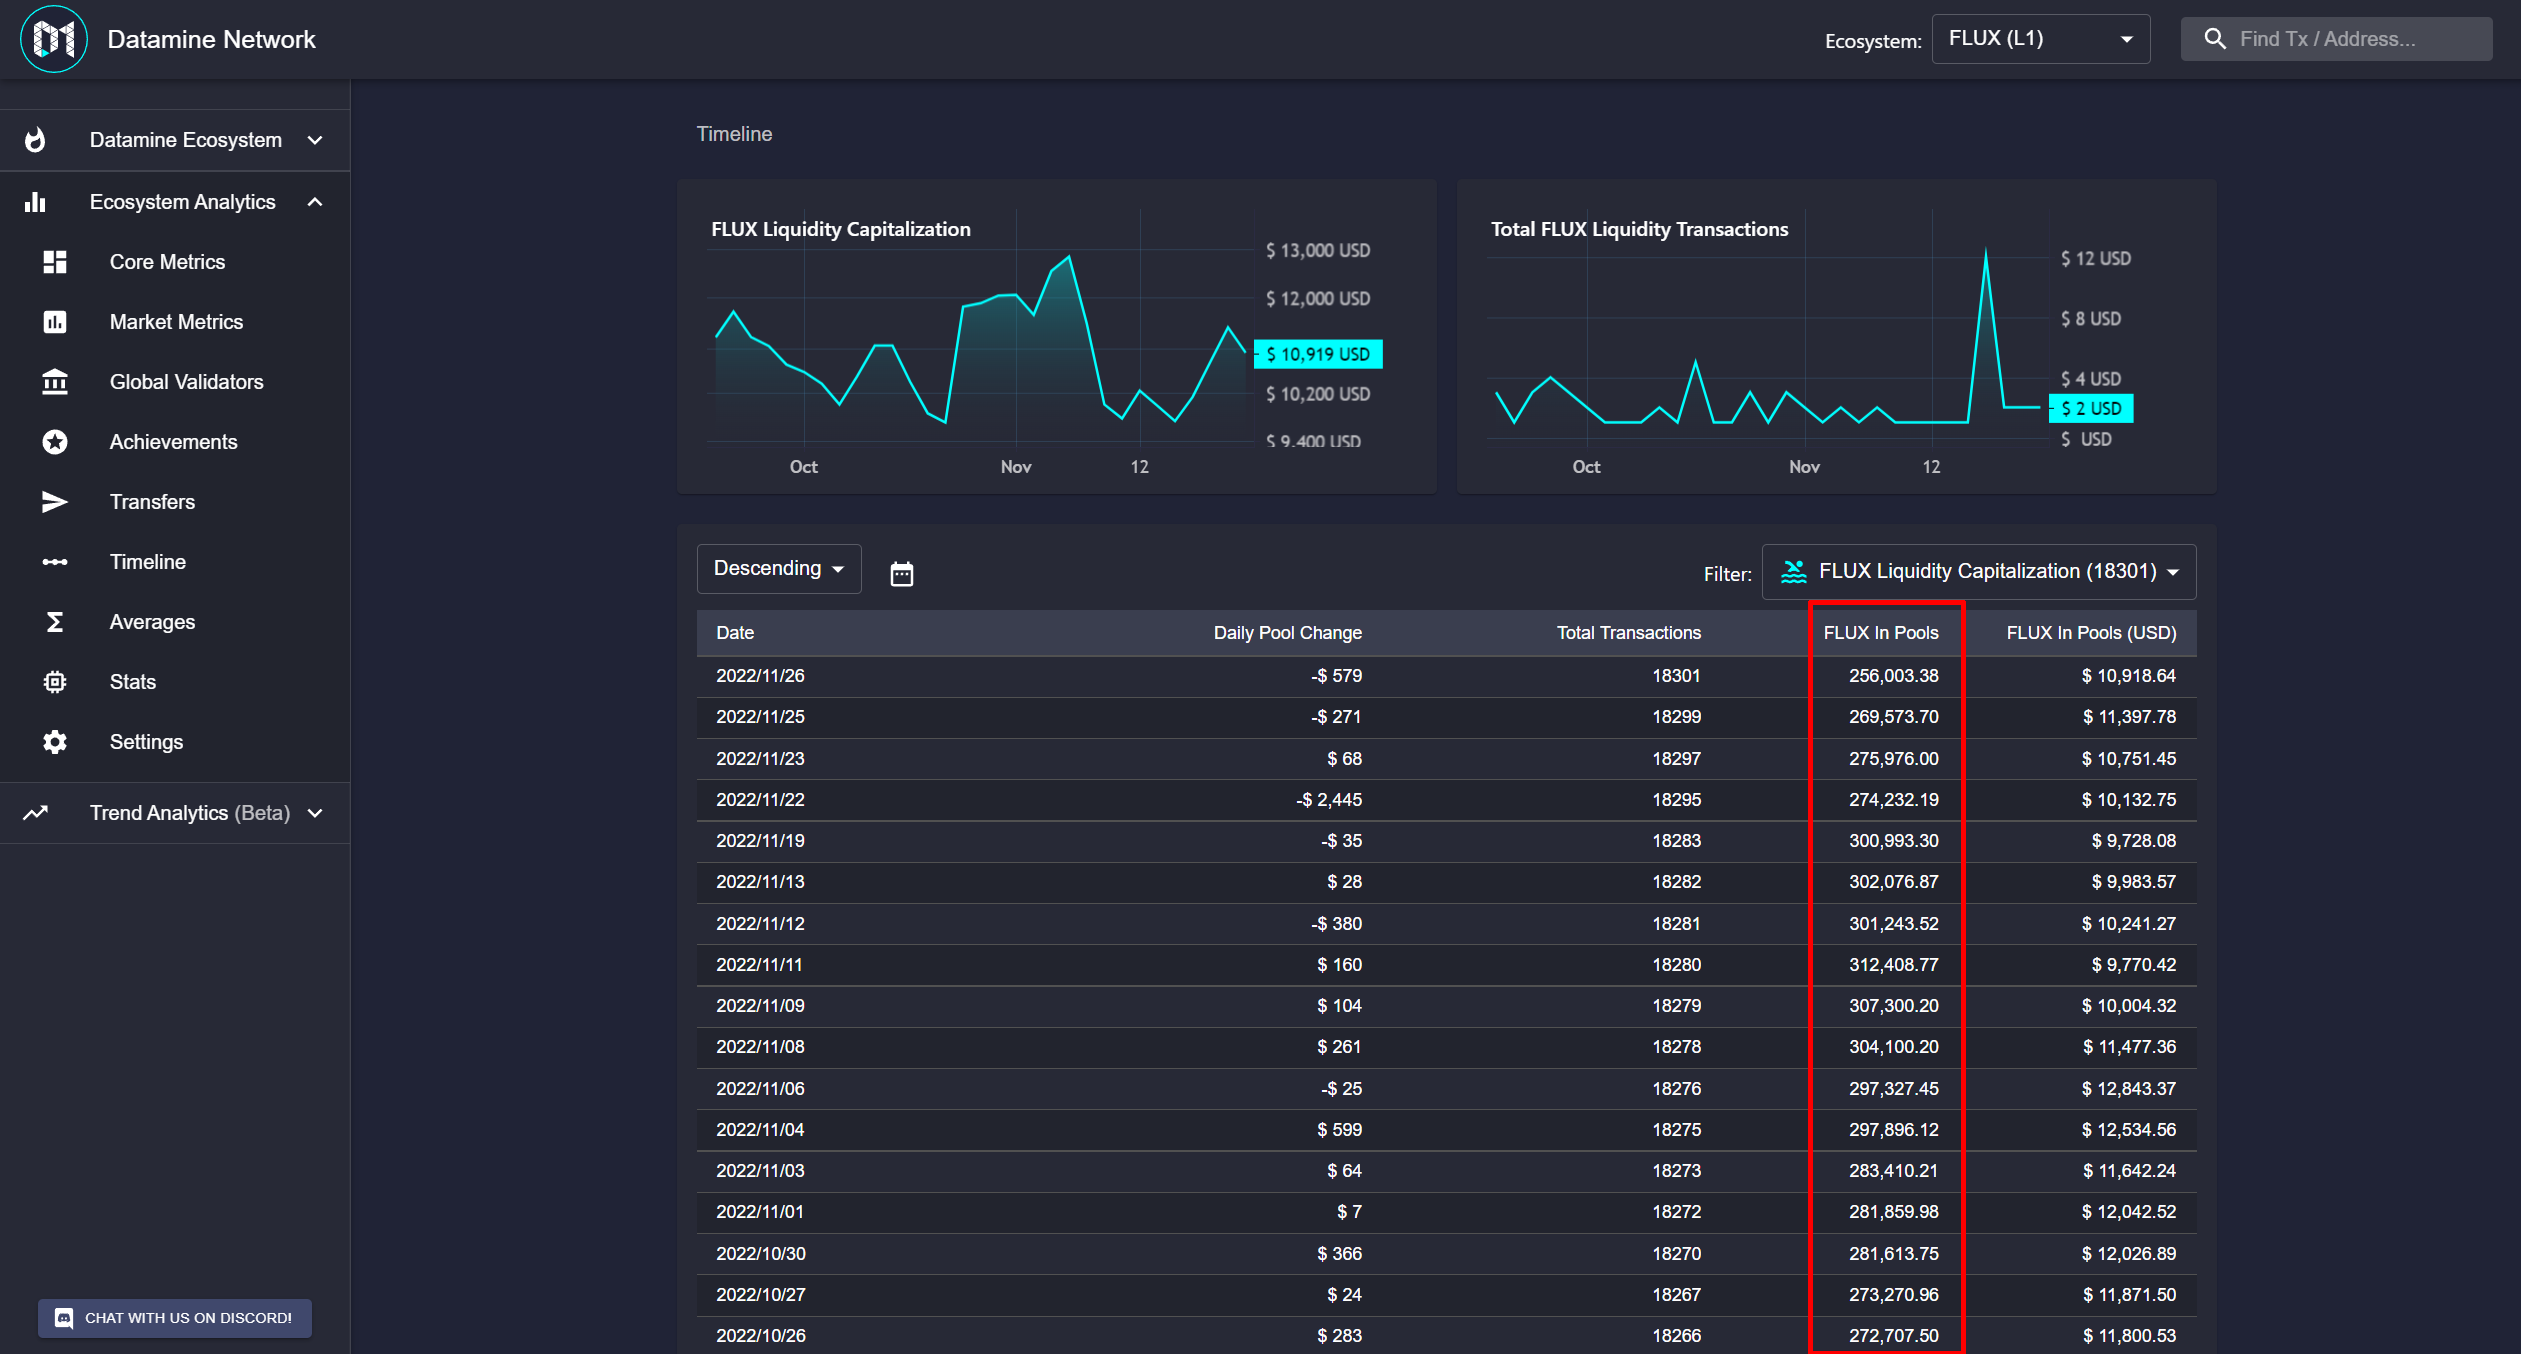
On top of this I've also been able to aggregate our liquidity metrics on L1 to utilize the same style of pool aggregation as we did on L2.
I've also removed Uniswap Timeline tab (this data was really confusing and incorrect) so it should remove some confusion for new people.
Keep in mind you can find the liquidity information in Timeline -> FLUX Liquidity Capitalization. This will track across multiple pools and we can add other liquidity pools as they come (ex: Uniswap V4, Balancer etc).
Be sure to check out the new feature Tomorrow, I don't want to spoil any surprises. 🙏
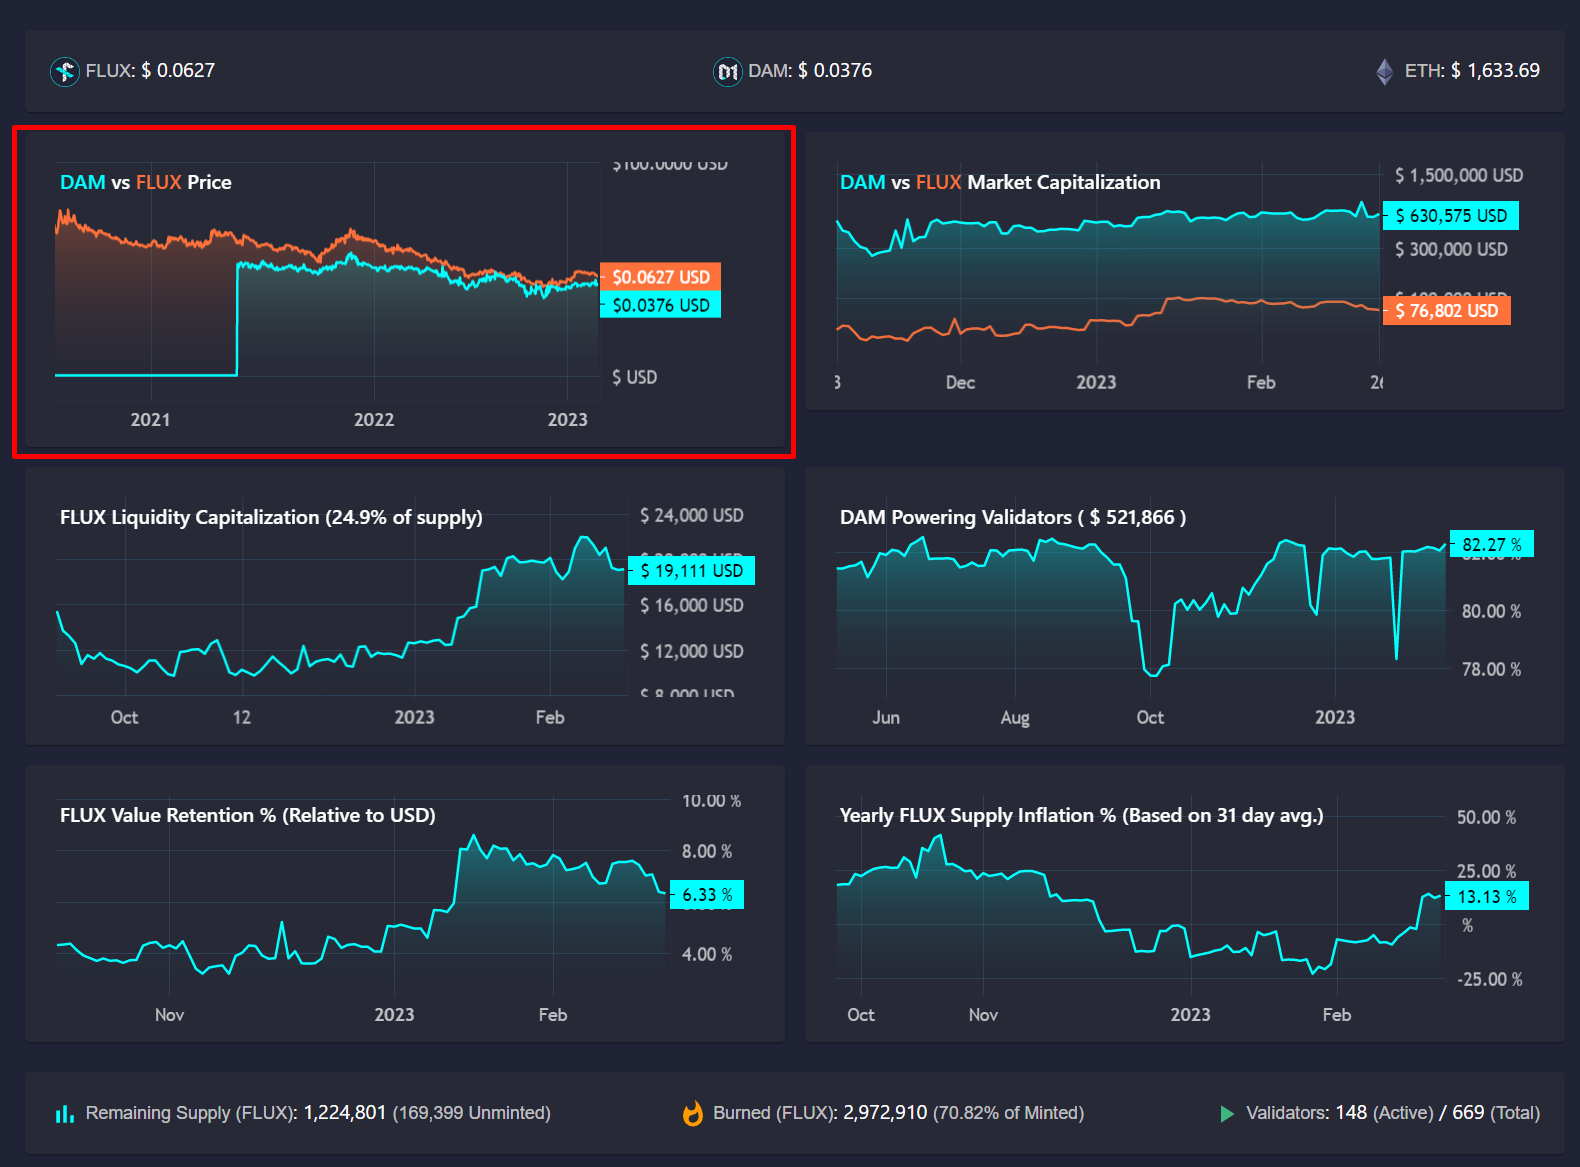
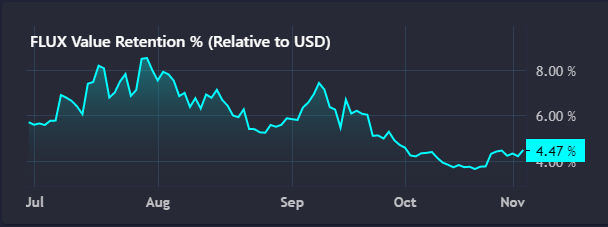
Hey guys I've improved our value creation metric to be one % value instead of two numbers like before. Now we can say "When it hits >=100% FLUX is creating value" (We've reached 100% once already but couldn't sustain.
Currently we're sitting at 4.47% which means on average FLUX is now valued 22x less than at time it was minted. Meaning currently FLUX value is not sustained.
However when we go >=100% that means FLUX is now valued more than at time of when it was minted.
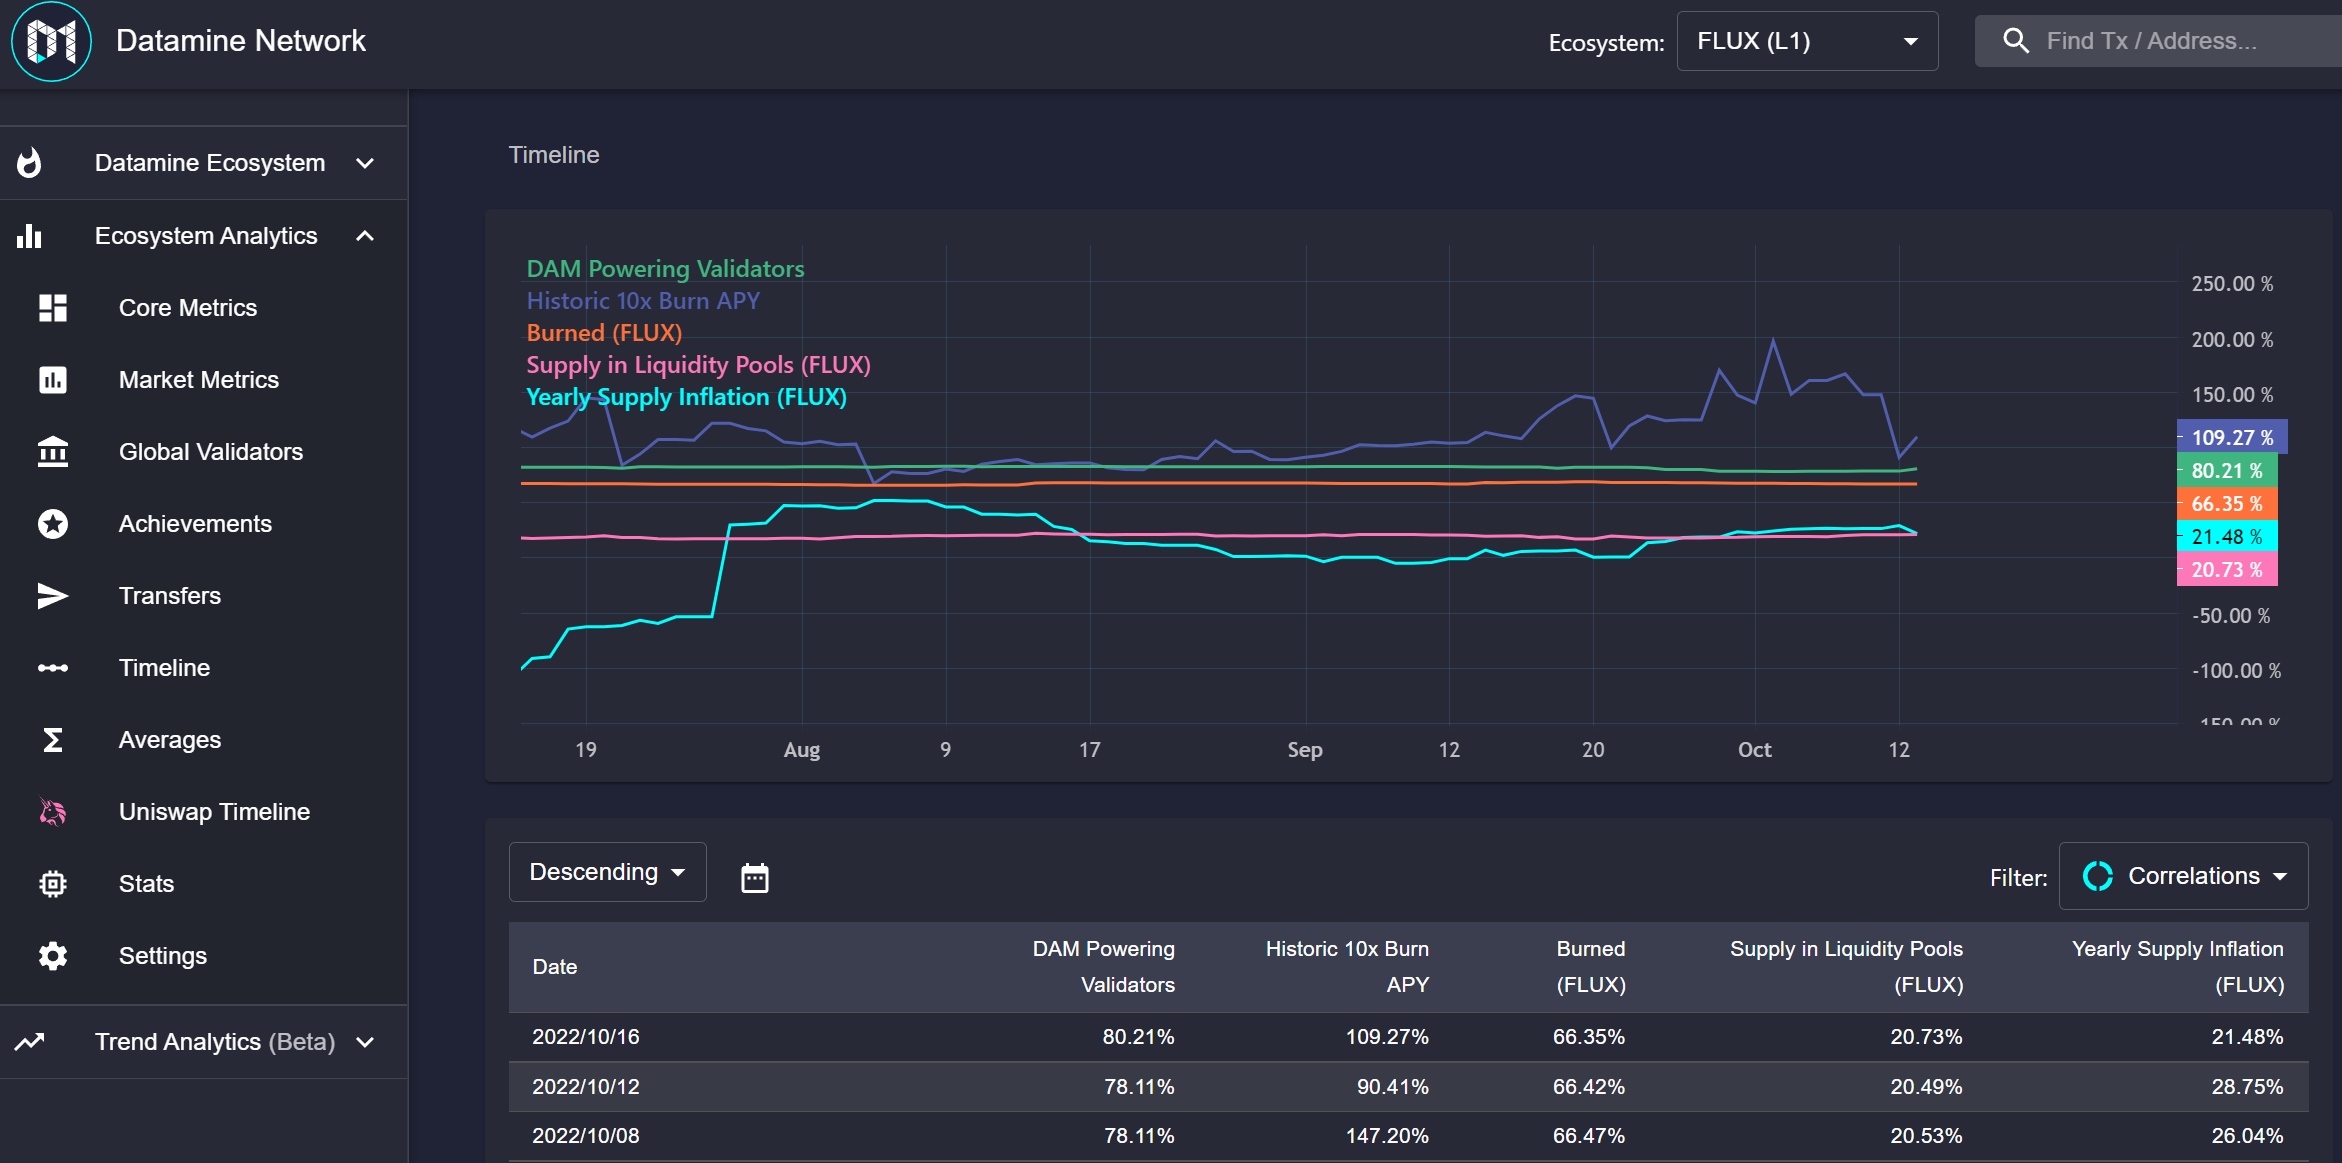
Also since it's now a % metric we can add it to our correlations timeline in the future.
PS: There is one more metric I want to add to the dashboard before this update goes live so stay tuned.
Two years ago I've had this vision of being able to correlate all the metrics on Datamine and answer questions like:
"If burn % is going up, how do we expect the locked % react?"
"What happens if people stop minting for extended periods of time"
"What if no one burns, what happens to inflation %?"
The vision was to convert all the metrics into percentage-based numbers.
The more percentage-based numbers we can correlate, the stronger the machine learning algorithm will be for our forecasting of correlations.
"Machine learning of forecasting correlations? Wait what?"
That's right 2 years ago I thought if Datamine gets to this exact point we should be able to throw all the correlations numbers to forecasting the future (of all percentages)!
So correlations launch will be a major milestone for us as it ties well into our "Forecasting" initiatives.
Ultimately the question I want answered here is "What happens next?". So we'll be looking into machine learning update to correlations in the future (think of it like Phase 2 of correlations).
So stay tuned, you'll be able to play with correlations soon! 🙏
Hey guys The Graph integration is live now, we're just resyncing some data but once it finishes we should have more accurate prices for all the historic data.
We actually query USDC/ETH liquidity pool size at specific blocks so the data is the most accurate representation of ETH price. We also save 1000x in storage size going forward this ensures we can scale when the gas prices are solved for Ethereum and transaction throughput increases.
Next update will allow us to add per-block times so we'll resync the ledger data to get a more accurate time representations (instead of guessing the times right now).
This just scratches the surface of the new integration and opens up many doors for us. It's a pretty epic update that I wanted to get out for a while.

 ArbiFLUX Launchpad" project
 · hodlforjesus · #dev-updates