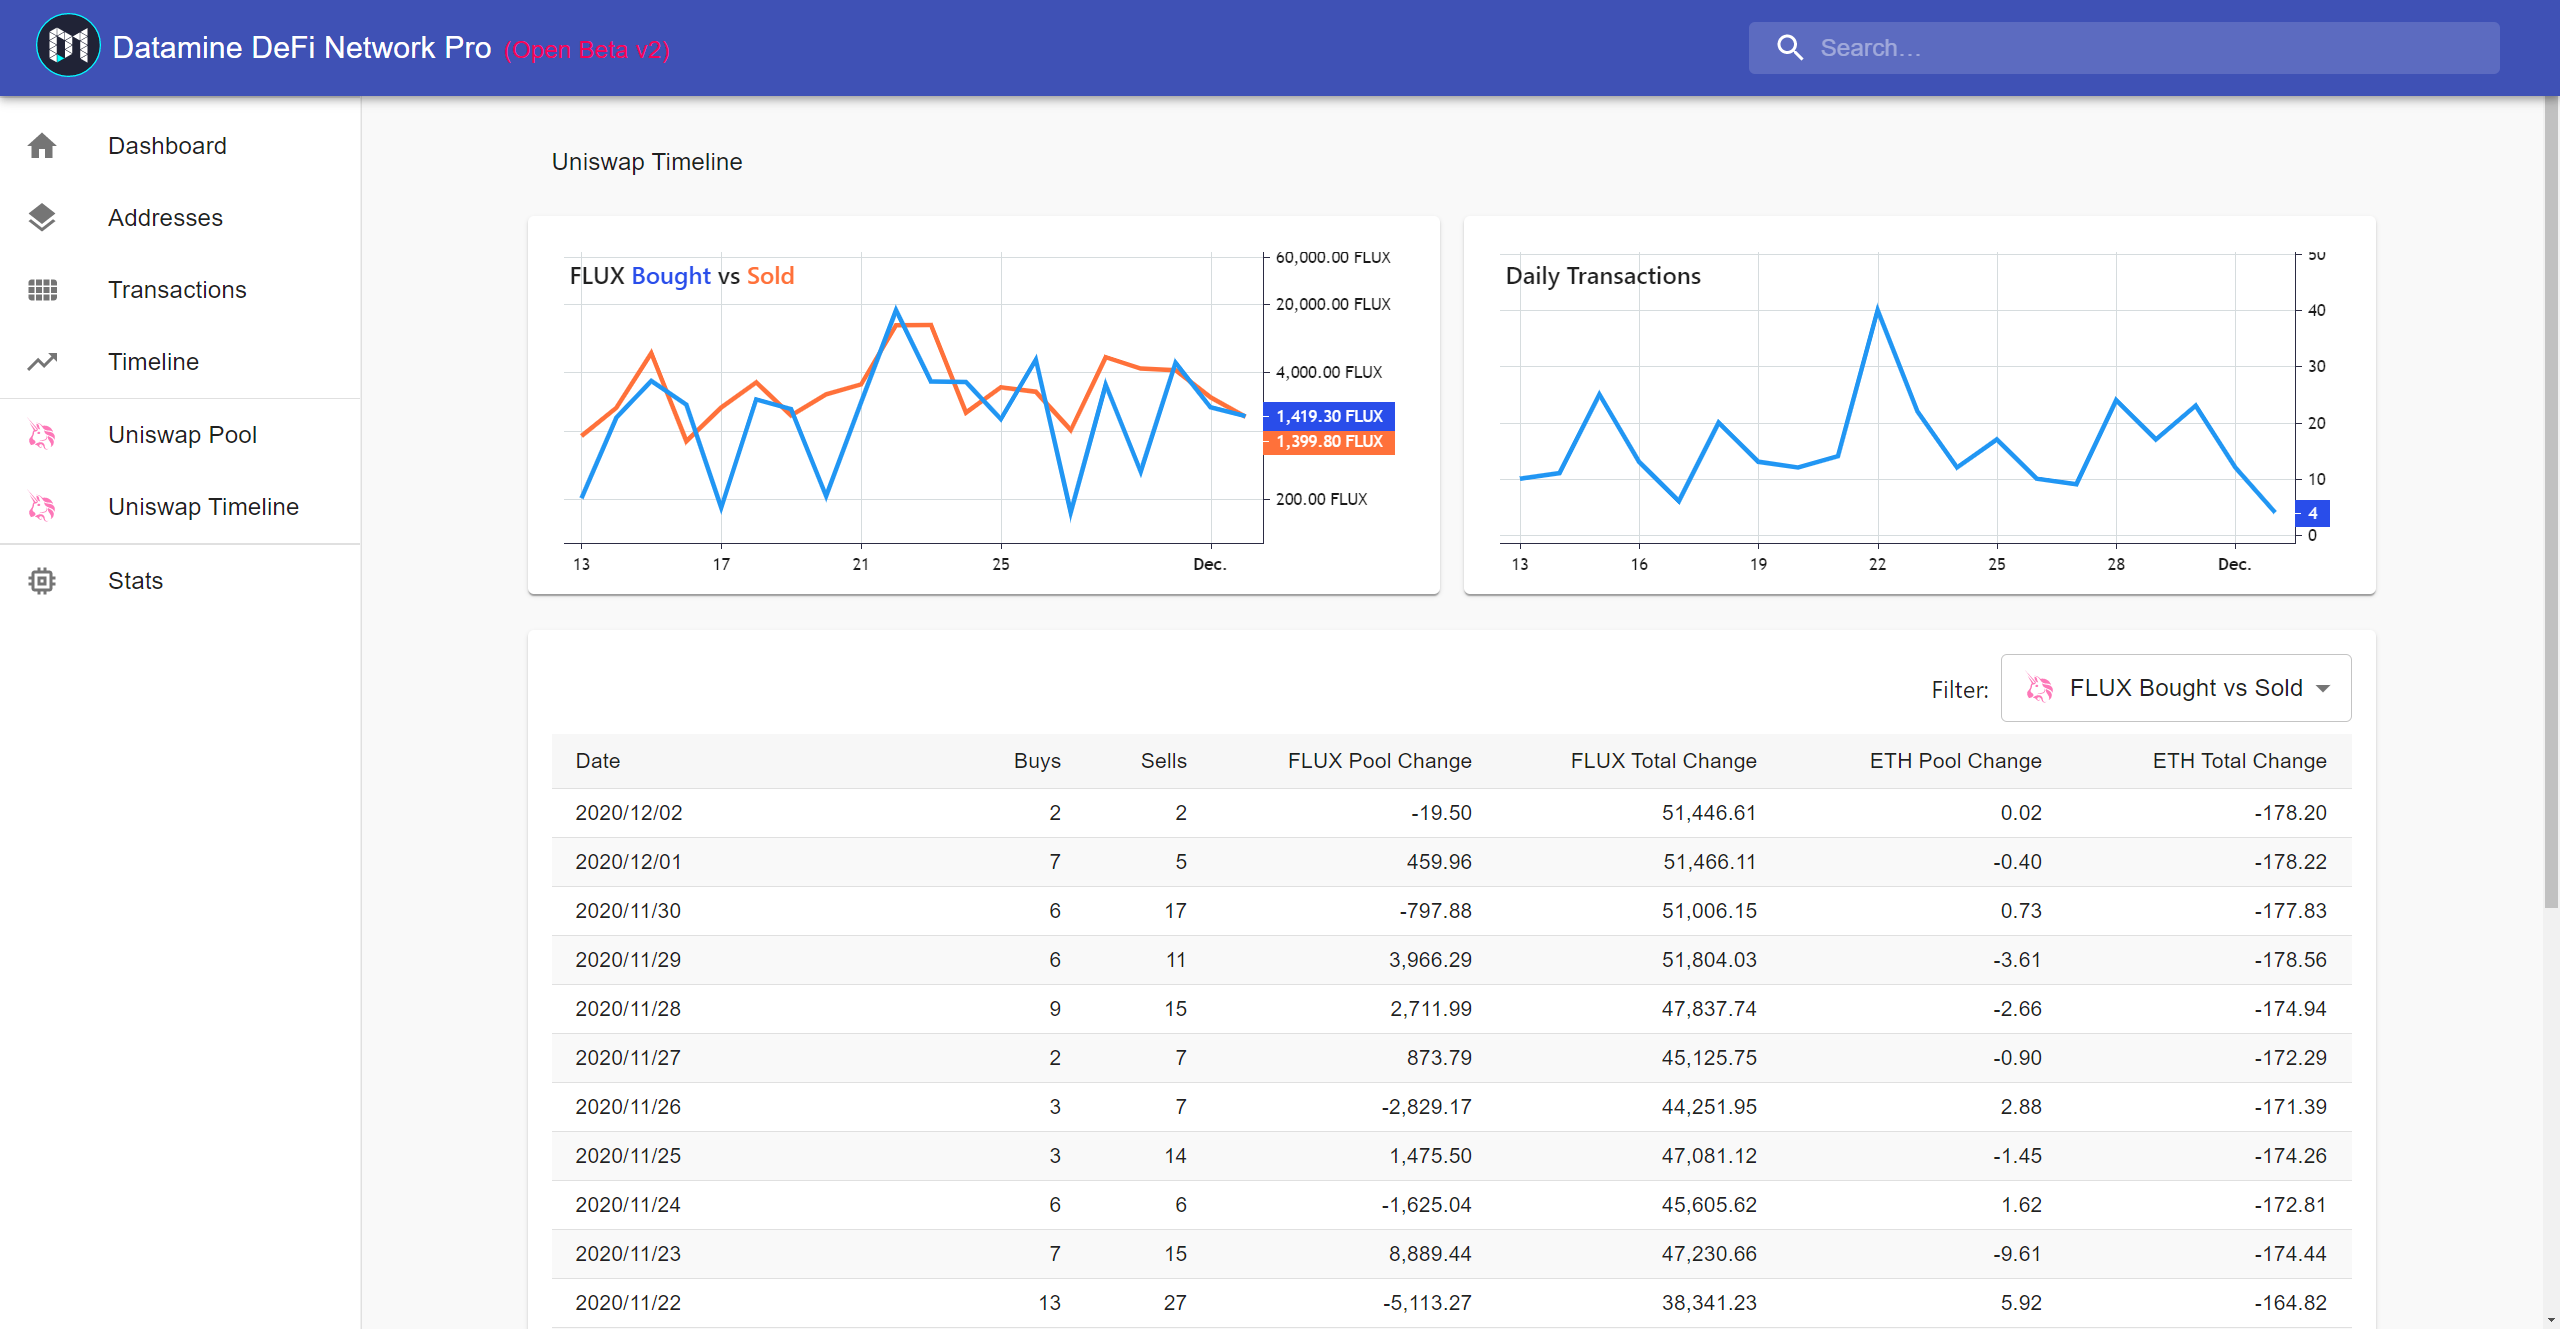
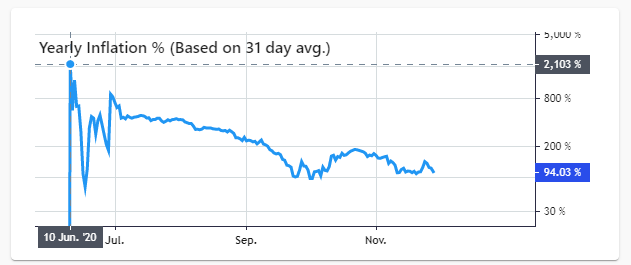
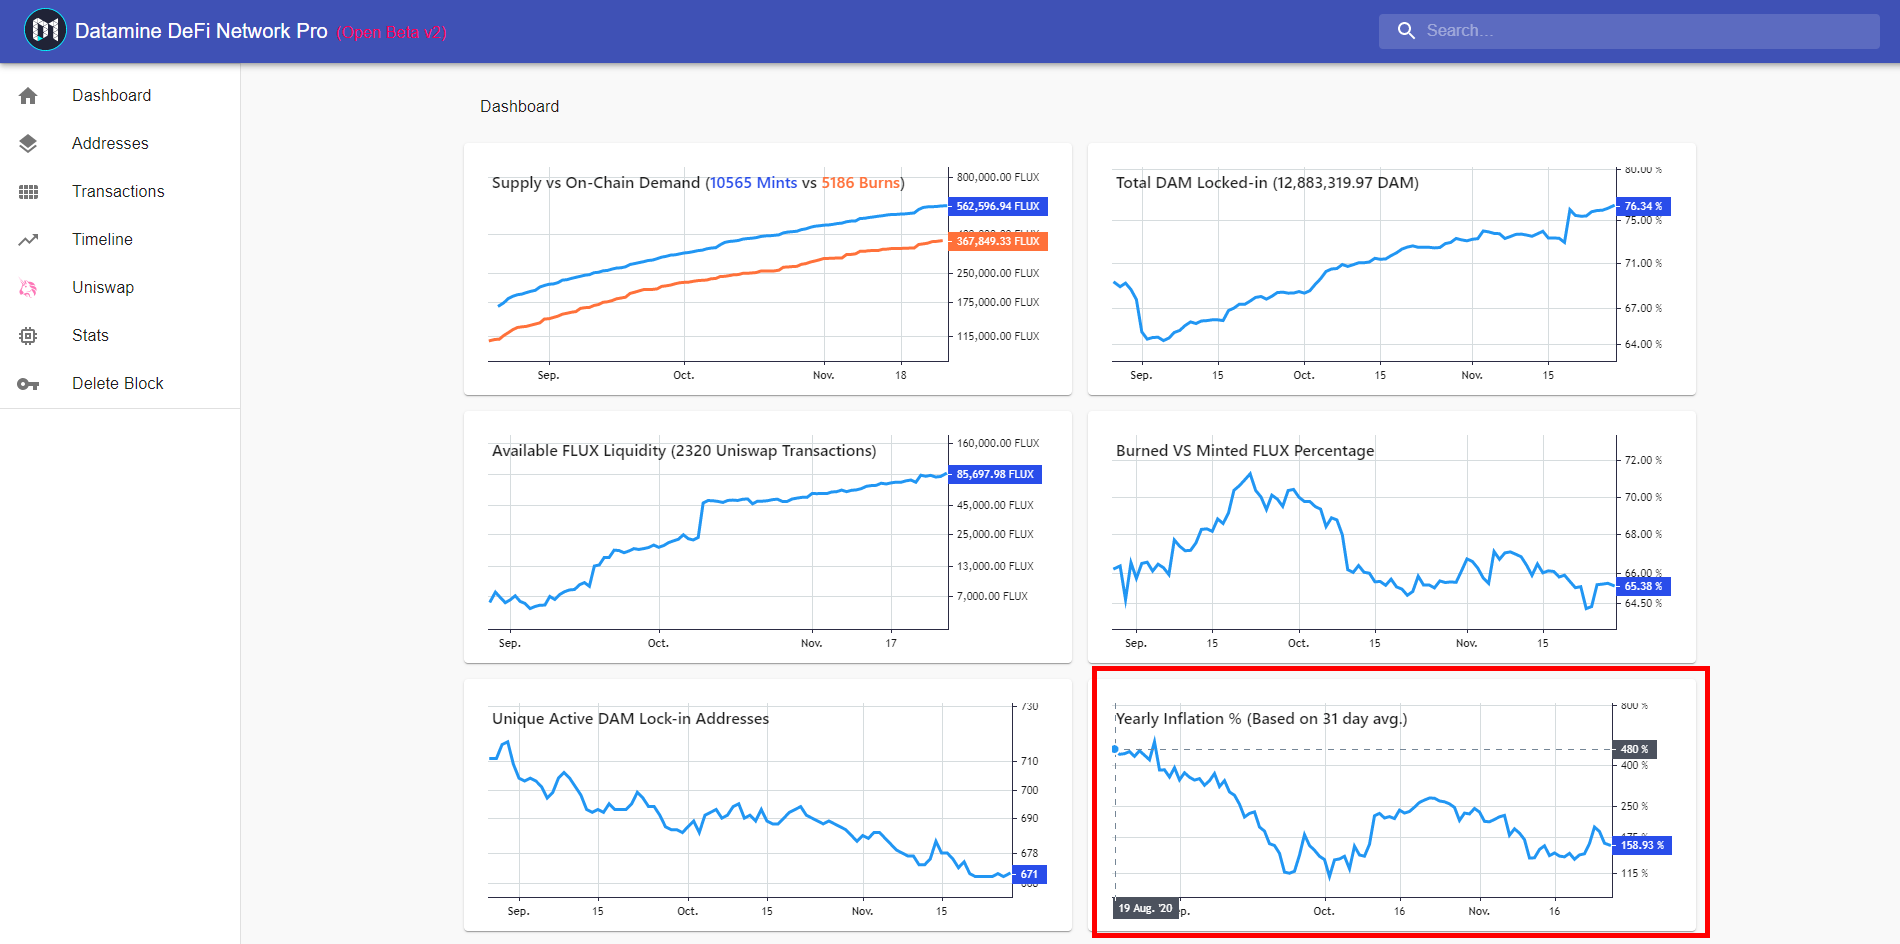
I've made a number of updates from the screenshot yesterday and also fixed dashboard wonky chart for inflation. There are extra columns for ETH pool changes as well so you can see how the pool performed in it's lifetime.
Current Stats:
51,446.61 FLUX
178.20 ETH
Not sure if any other analytic tools show these stats yet, but I found them quite fascinating. That means on average each FLUX sold for $2.03. Also over $104,770 of FLUX was sold on Uniswap! (at current prices)
I will jump onto merging two dashboards into one seamless realtime experience.
Basically the merged dashboard will start in a Decentralized mode, where no external resources are accessed (as it is now). And then there will be current pro buttons. When you click them they will give you an option to exit decentralized mode and access the pro features. Once you exit decentralized mode you can browse any pro features without nagging.
I think you guys will love the new upcoming dashboard as it's two experiences in one awesome package 🔥
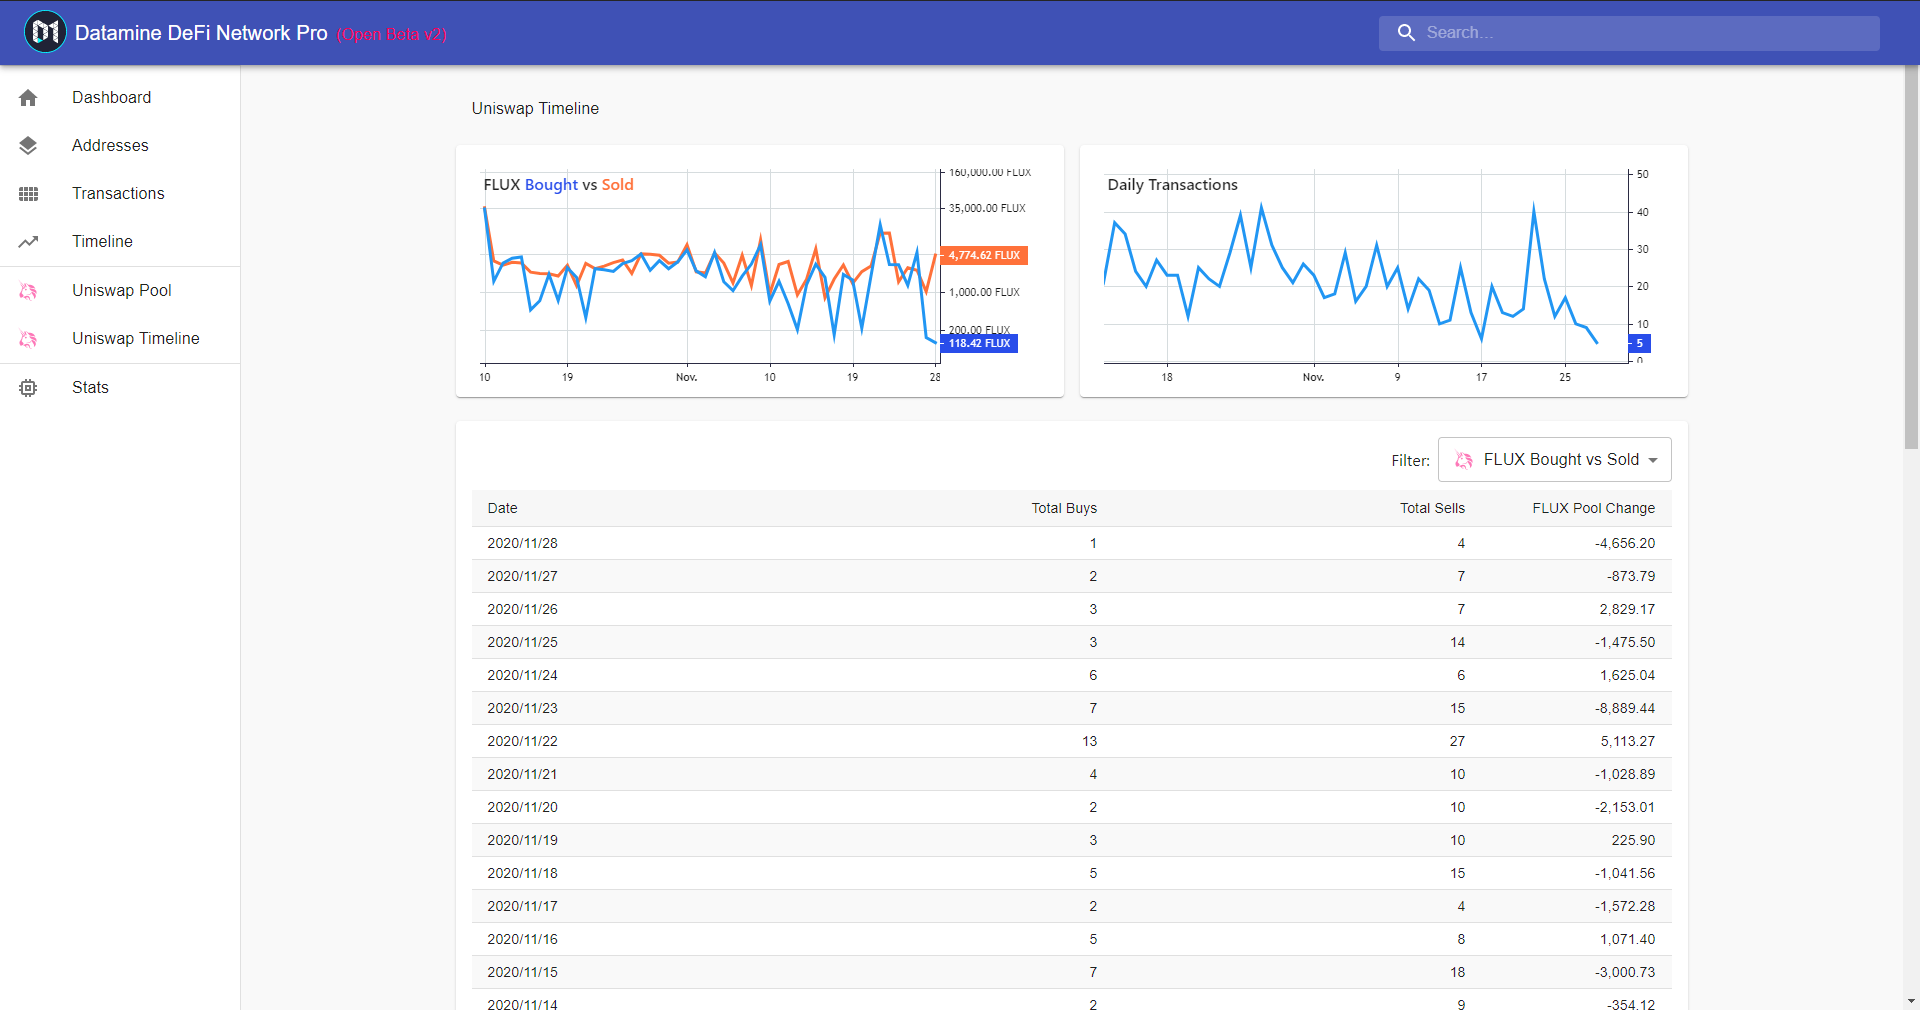
Time I show off the new Uniswap Timeline page. This page provides another set of useful information regarding Uniswap pools. At the moment this is only available for FLUX but we'll also add DAM in a future update.
On this page you can see a breakdown of how the FLUX pool changes. If the amount is negative that means more FLUX was sold to the pool than bought. As our pool grows it's great to see how it changes overtime.
Along with this you can see daily transactions. There will be another set of data points in a future updates for Averages which will illustrate buy/sell momentums.
Will add a sum and release this tomorrow, don't forget this can be applied to any Uniswap pair in the future. 🔥
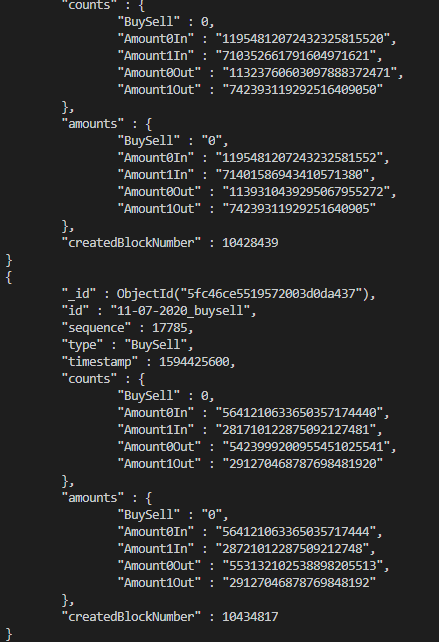
Got Uniswap buy/sell data into timeline structure. Will have that hooked into frontend this week, for an idea of what that looks like check out the Timeline tab. We'll start with daily buys/sells and expand this into liquidity timeline data points at a later time.
After the Uniswap timeline update is out I want to finish up per-address charts as that feature has the data and just needs some frontend work.
After the per-address charts I would like to consolidate Uniswap and FLUX into a more structured frontend selection. This will allow us to add DAM Pro analytics as well to go along side FLUX.
Still lots to do but pro analytics is starting to look more polished and feature full. Hoping you guys are using it every day, at least check out the core metrics! 🔥
Just wanted to do another update on why this new inflation metric is so important. Back in June 10, 2020 FLUX inflation was at astounding 2103%. It is now down to just 98.41% in only a matter of months. I've attached a set of data so you can see exactly what the whole picture looks like.
With our linear & predictable FLUX distribution we're on our way towards 0% inflation (with possibility of negative inflation).
Inflation by dates:
July 01 - 695%
August 01 - 423%
September 01 - 229%
October 01 - 77%
November 01 - 151%
November 28 - 94%
Tomorrow I plan on jumping to Uniswap Timeline and get some initial data so be sure to follow for updates. 🔥
I have finally finished the daily inflation chart. We can now finally understand the rate of FLUX inflation.
Before FLUX burning: 308.35% (Down from 1,000% in August)
After FLUX burning: 158.93% (Down from 480% in August) Inflation
This means we'll be hitting DOUBLE DIGIT INFLATION in about a month. As you can see the burning is also contributing towards reducing inflation by half!
This new metric will be available on the Pro Dashboard Core Metrics tomorrow so you can check it out on daily basis! 👀
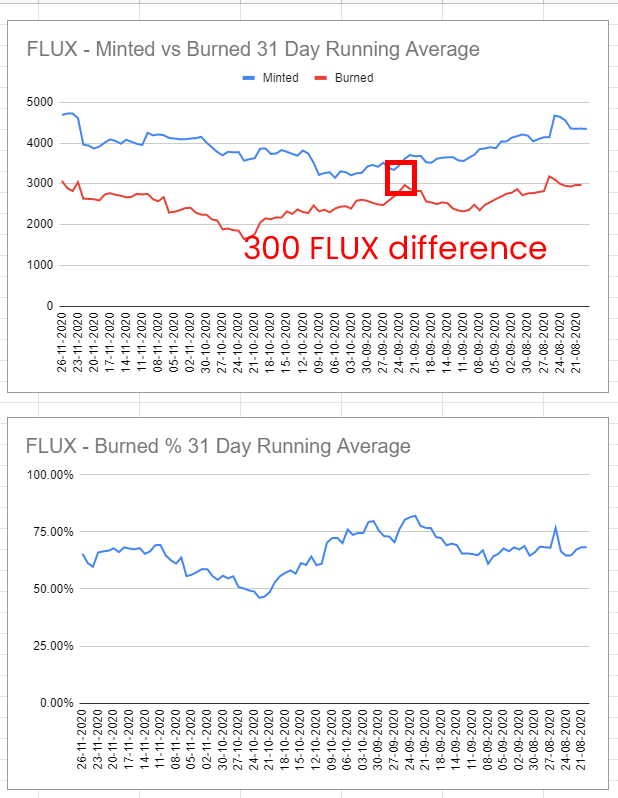
Here is another exciting timeline update that will be launching in the next Pro dashboard update - MINT VS BURN 31 day average. This new data will give you an idea of when we're getting close to a NEGATIVE INFLATION which is possible when more FLUX is burned on average than minted.
I've attached such an example where we only had 300 FLUX difference. This new timeline averages update will also be applied to Uniswap BUY vs SELL so you can get a similar idea of how the pool is performing.
Really excited to finish up this Averages update as it gives us more data points to work with 🔥

 DAM ( $819,508 ) is locked-in to Mint
  FLUX. Over $200,000.00 of
 · hodlforjesus · #social-updates