
Datamine Pro Dashboard Introduces Mint vs Burn Metrics
💡 AI Article Summary
Datamine Network is rolling out an update to its Pro dashboard, introducing a 31-day moving average tracker for Mint vs. Burn metrics. This feature provides real-time transparency into token emission dynamics, helping users visualize the ecosystem's deflationary progress.
Tracking Toward Negative Inflation
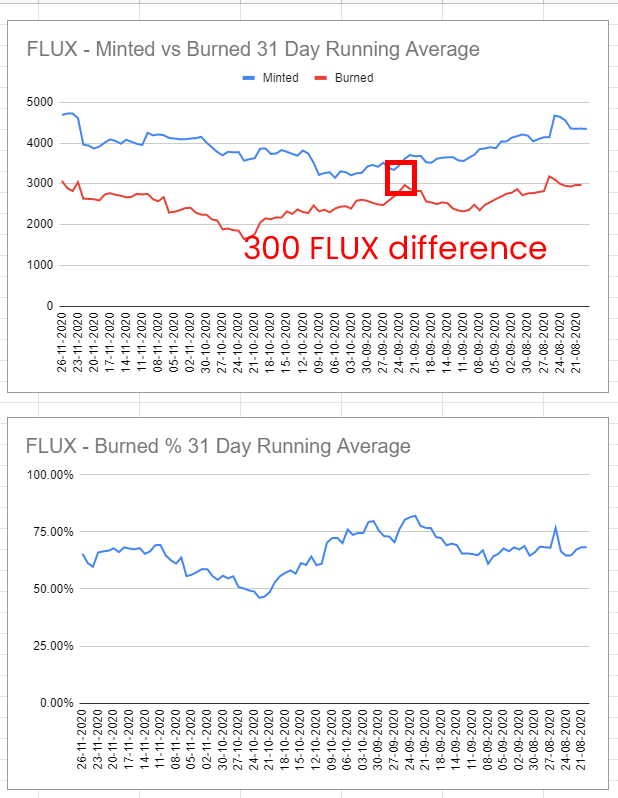
The primary goal of this new metric is to monitor how close the network is to achieving negative inflation. Negative inflation occurs when the volume of FLUX burned on average exceeds the amount minted. Recent on-chain data highlighted a temporary difference of just 300 FLUX between minting and burning, demonstrating how close the ecosystem is to this milestone. By utilizing this 31-day average, validators can gauge the velocity of token destruction and its impact on the circulating supply.
Uniswap Buy vs. Sell Averages
In addition to minting and burning, this moving average framework is being integrated into Uniswap liquidity pool analytics. The dashboard will track Buy vs. Sell 31-day averages, offering liquidity providers and traders deep insights into pool performance, volume trends, and overall market velocity without relying on centralized data sources.
Hey guys,
Here is another exciting timeline update that will be launching in the next Pro dashboard update - MINT VS BURN 31 day average. This new data will give you an idea of when we're getting close to a NEGATIVE INFLATION which is possible when more FLUX is burned on average than minted.
I've attached such an example where we only had 300 FLUX difference. This new timeline averages update will also be applied to Uniswap BUY vs SELL so you can get a similar idea of how the pool is performing.
Really excited to finish up this Averages update as it gives us more data points to work with 🔥
Frequently Asked Questions
What is negative inflation in the Datamine ecosystem?
Negative inflation occurs when the total amount of FLUX burned through the system's yield-generating mechanics exceeds the amount of new FLUX being minted over a given period, leading to a net reduction in supply.
How does the 31-day Mint vs. Burn average help users?
It provides a smoothed, rolling average of token creation and destruction, allowing participants to easily assess the net inflation or deflation of FLUX without being misled by short-term daily volatility.
Will this analytical update apply to decentralized exchanges?
Yes. The same 31-day moving average calculation is being applied to Uniswap Buy vs. Sell data to help users analyze trading pressure, pool health, and liquidity trends.
 · hodlforjesus · #dev-updates