
Datamine Network Integrates Multi-Chain Charts for DeFi Yields
💡 AI Article Summary
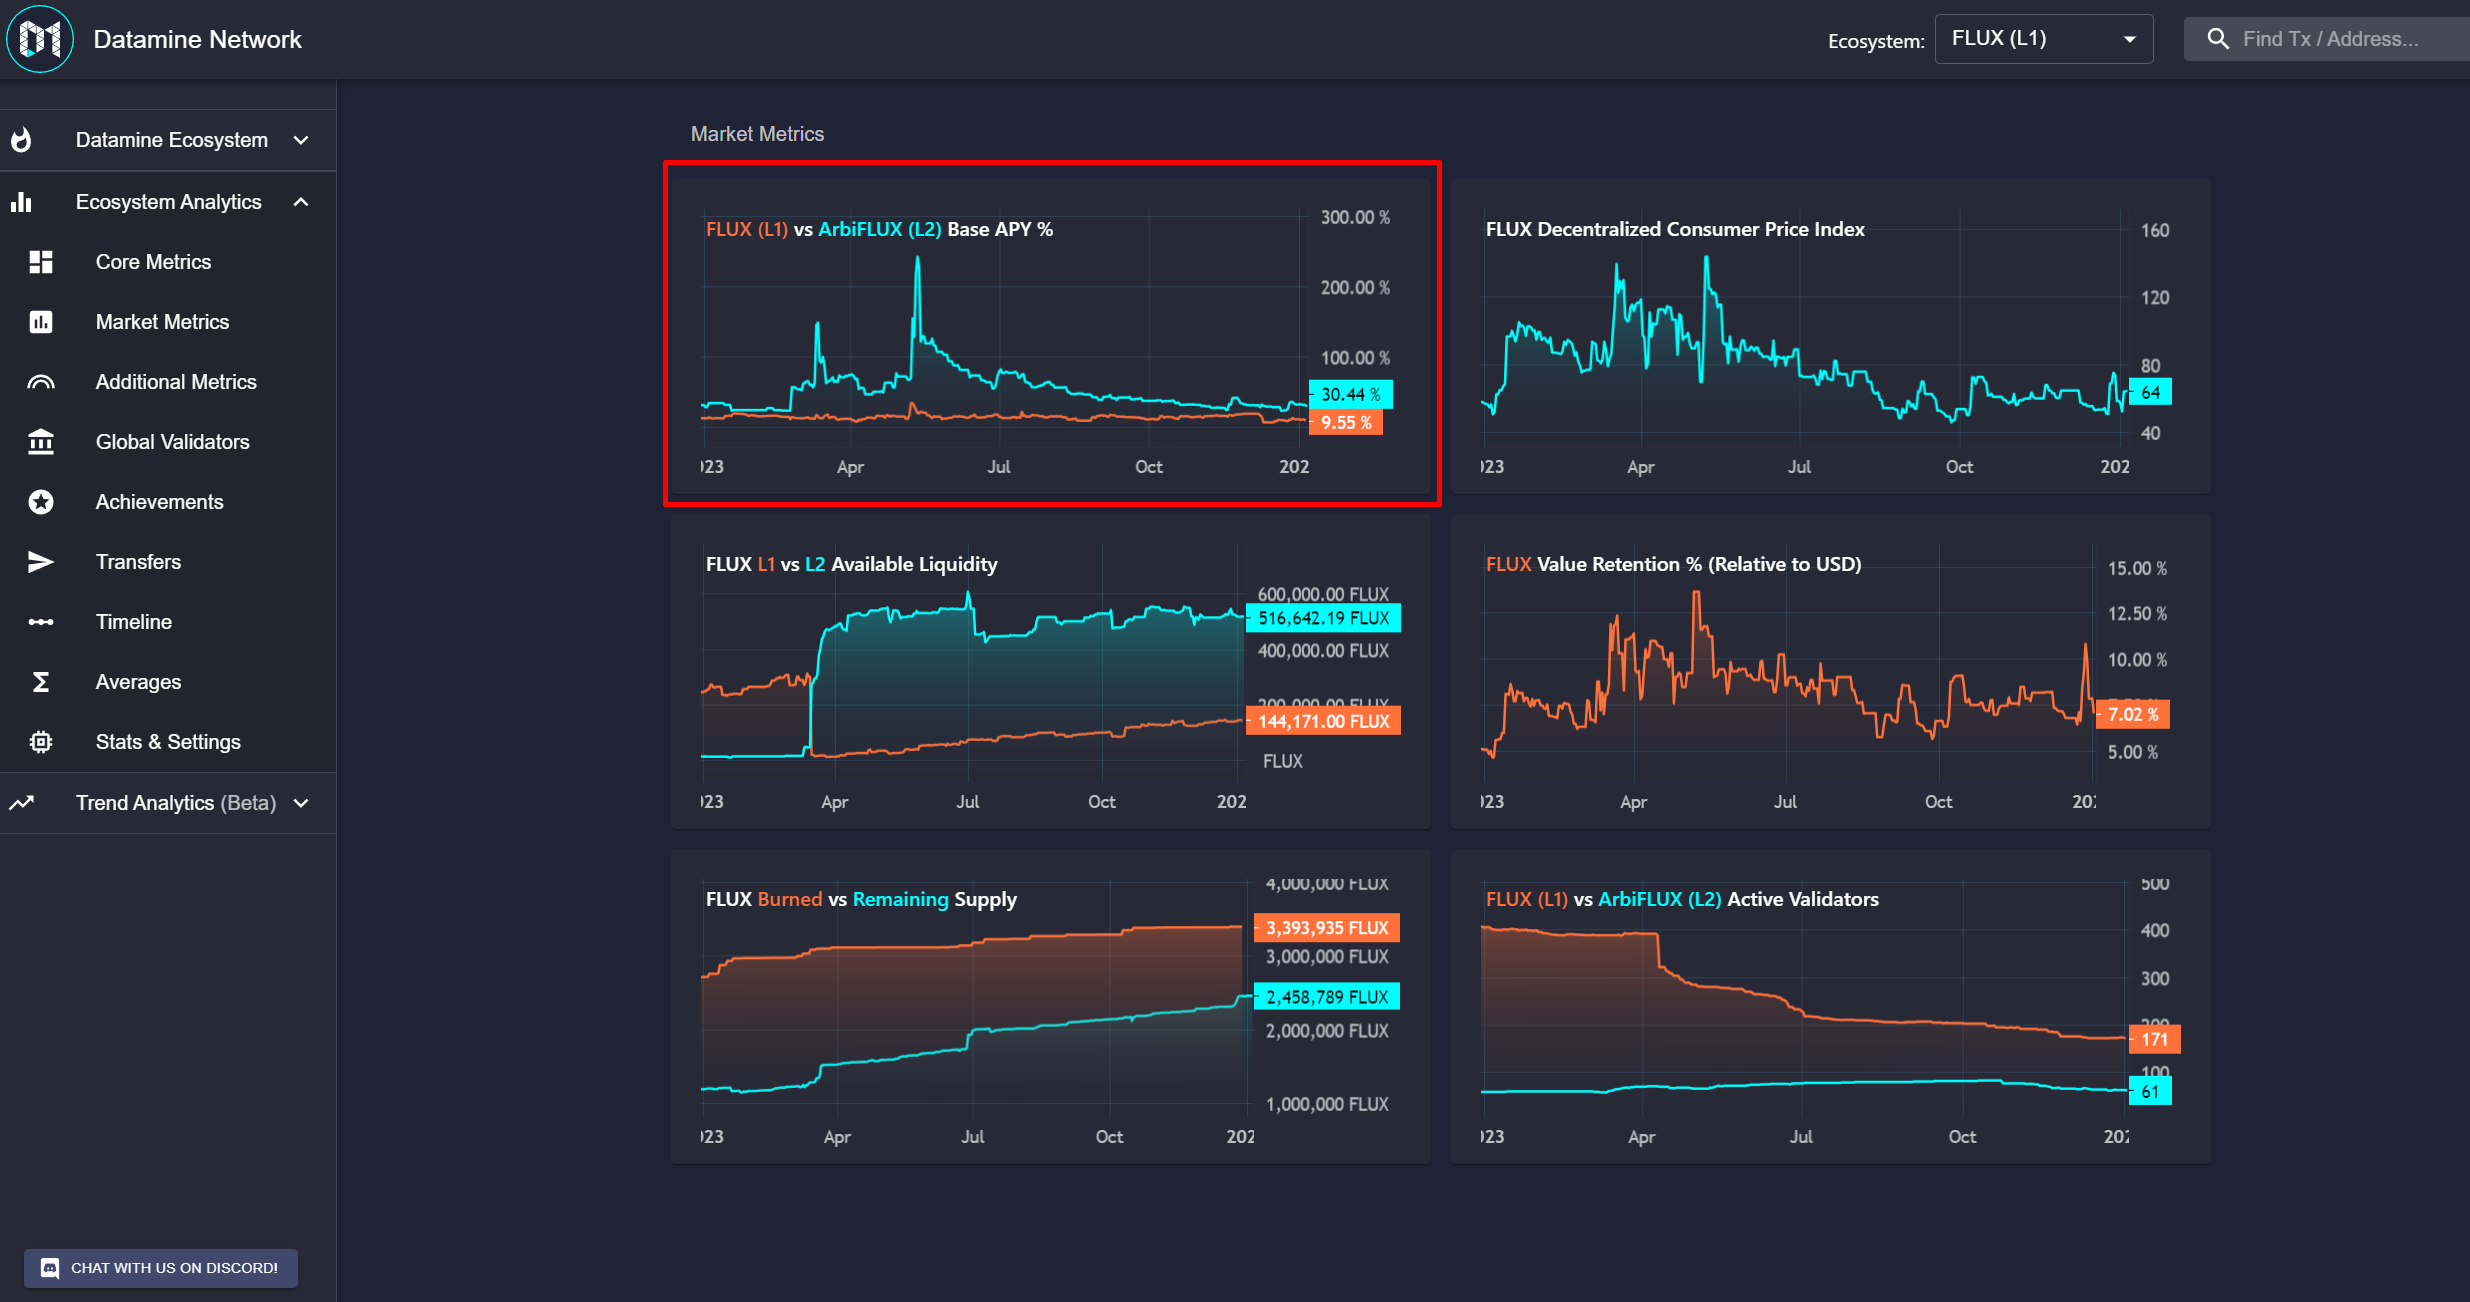
The Datamine Network has expanded its decentralized dashboard by integrating more Layer 1 (L1) and Layer 2 (L2) charting data. This update provides users with deeper visibility into the ecosystem's real-time performance and cross-chain metrics.
Stabilizing Layer 2 Yields
Since April, the base Annual Percentage Yield (APY) for minting ArbiFLUX on Arbitrum (L2) has automatically adjusted to manage increased network demand. This stabilization demonstrates the protocol's built-in dynamic balancing logic. In comparison, the L1 FLUX base APY is currently sitting at 9.55%.
Market-Controlled Inflation
The Datamine monetary system relies on autonomous smart contracts to manage tokenomics without centralized control. This decentralized approach uses incentivized burning and dynamic locking mechanisms—such as locking DAM to mint FLUX, and locking FLUX to mint ArbiFLUX—to balance inflation and yield based on actual market participation.
🔥We're fusing more L1 + L2 charts for our DeFi ecosystem!
L2  ArbiFLUX minting base APY has been automatically stabilizing since April to handle the new demand!
You can compare this to  FLUX base APY which is currently sitting at 9.55%!
Be sure to check out how our market-controlled inflation creates a fully dynamic market!
https://t.co/MBsMTkMliq
Frequently Asked Questions
What is the difference between FLUX and ArbiFLUX?
FLUX is the Layer 1 utility token minted by locking DAM on Ethereum, while ArbiFLUX is the Layer 2 efficiency token minted by bridging and locking FLUX on Arbitrum to reduce transaction costs.
How does Datamine stabilize its minting APY?
The ecosystem uses market-controlled inflation and decentralized smart contracts to automatically adjust base APYs like ArbiFLUX in response to shifting network demand.
What is the current base APY for FLUX on Layer 1?
The base Annual Percentage Yield (APY) for FLUX minting on Layer 1 is currently sitting at 9.55%.
Why does Datamine integrate L1 and L2 charts?
Integrating multi-chain charts allows users to analyze real-time market data, inflation metrics, and liquidity pools across both Ethereum and Arbitrum from a single decentralized dashboard.

 · hodlforjesus · #social-updates