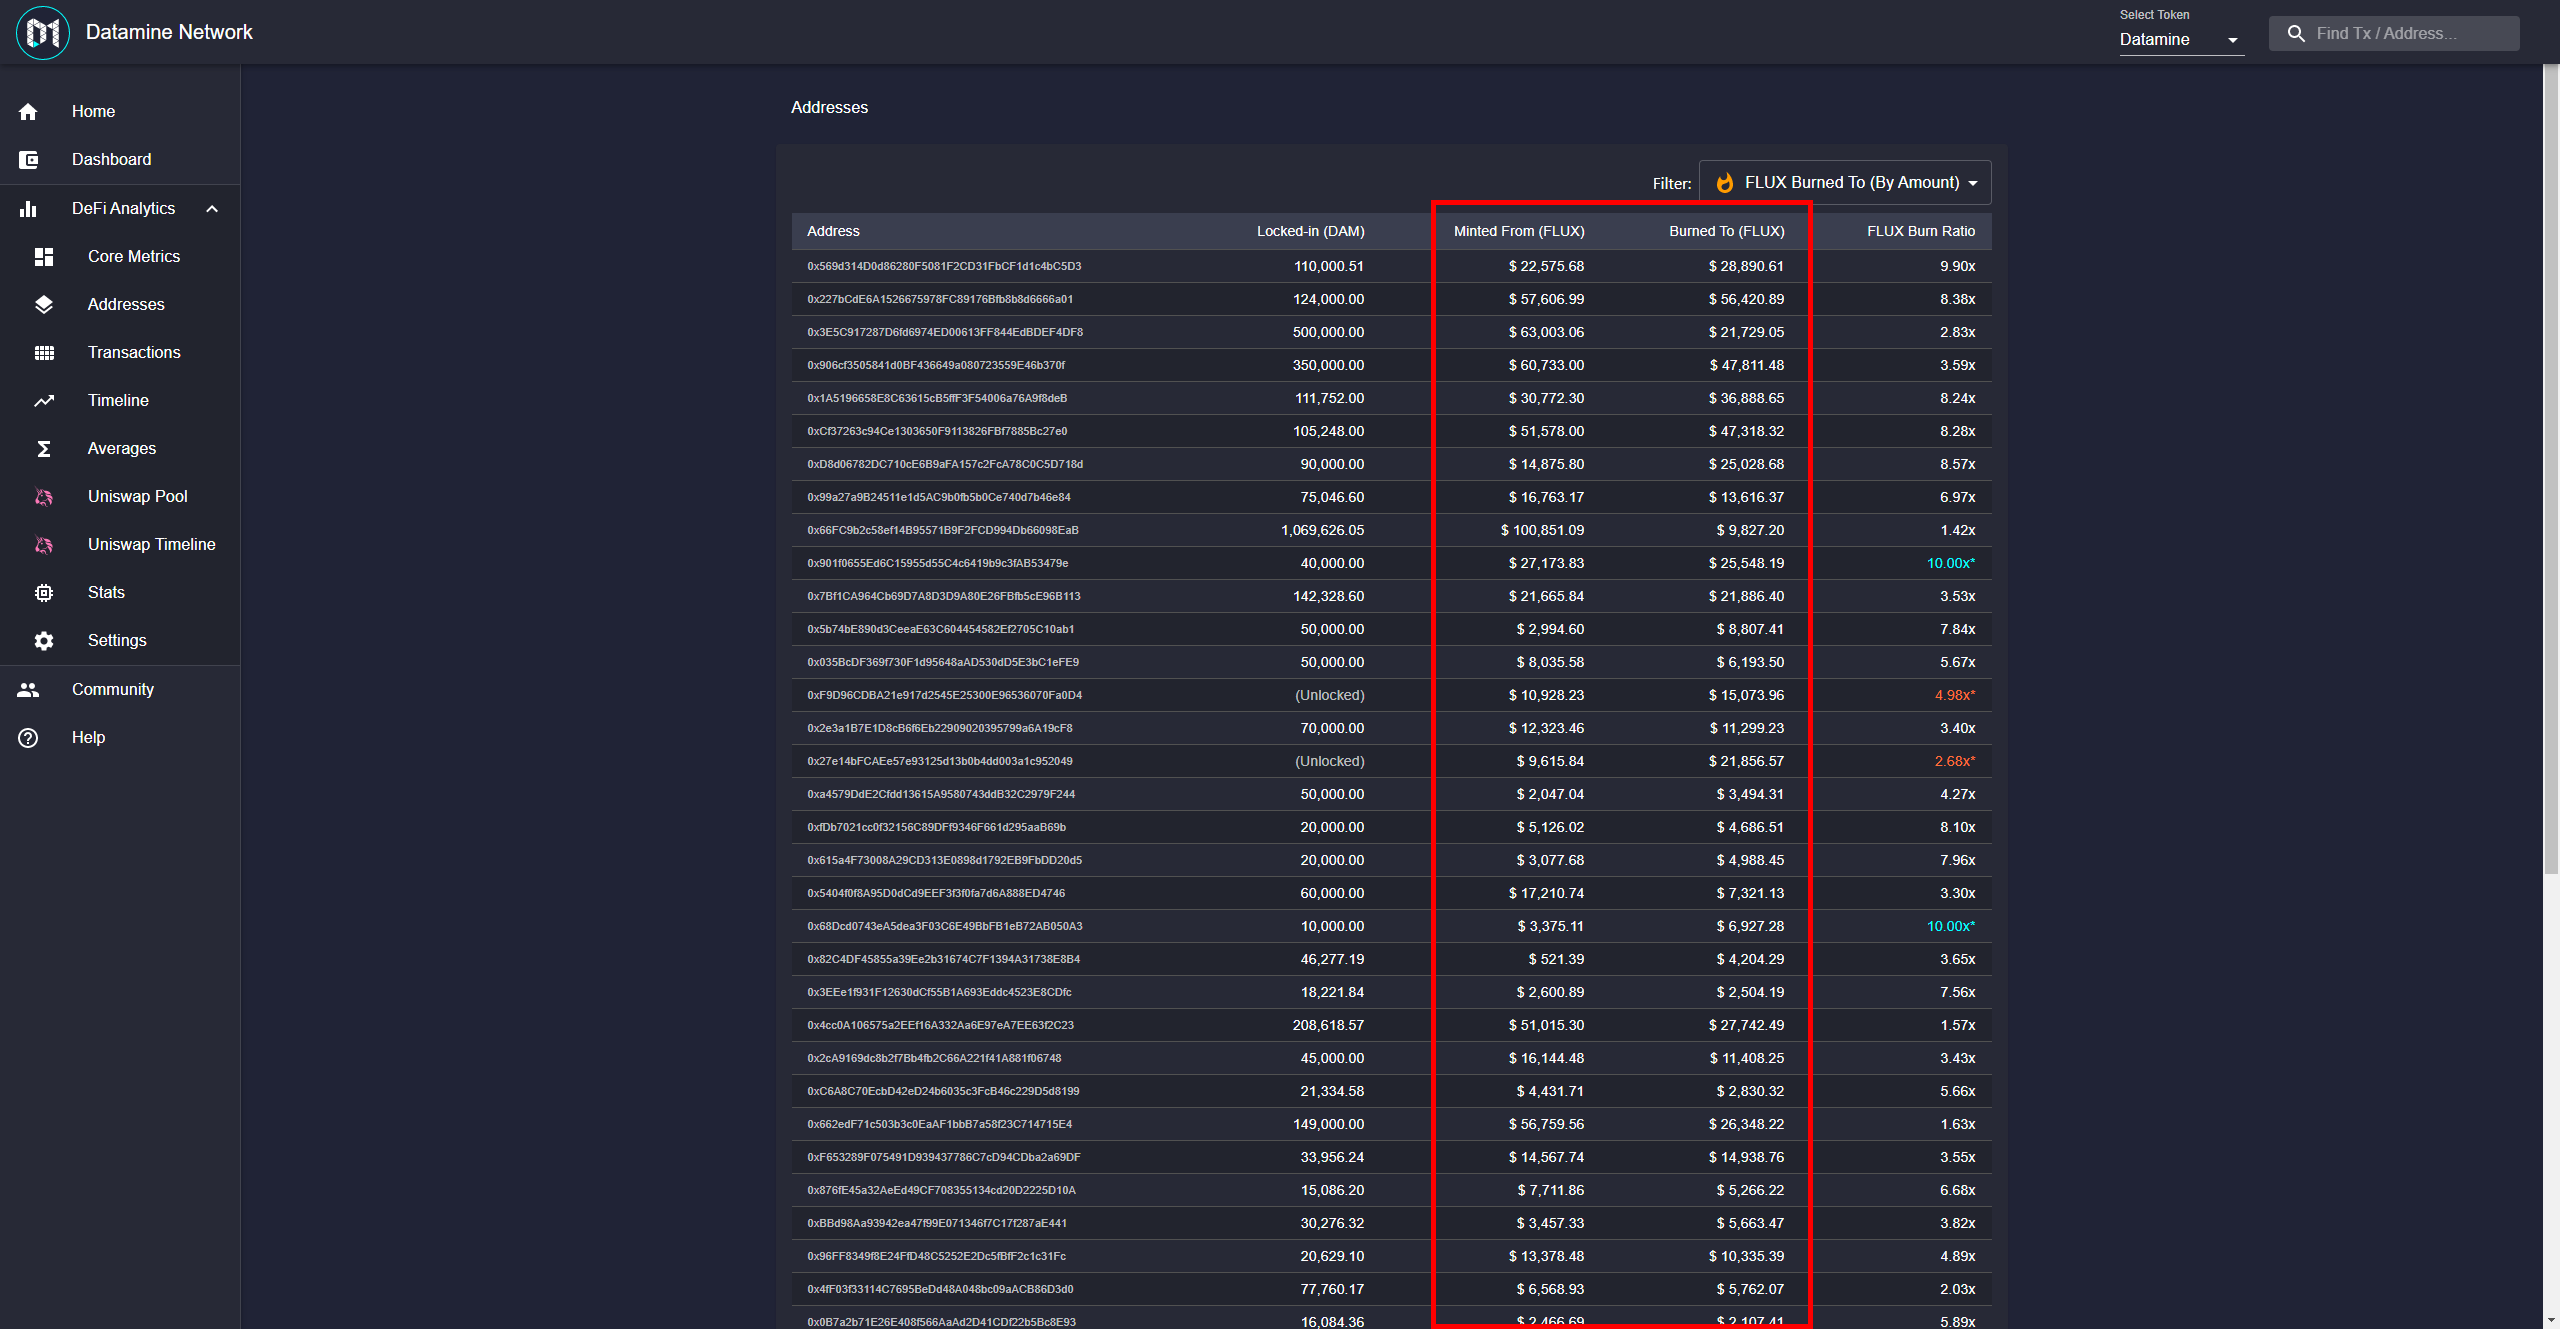
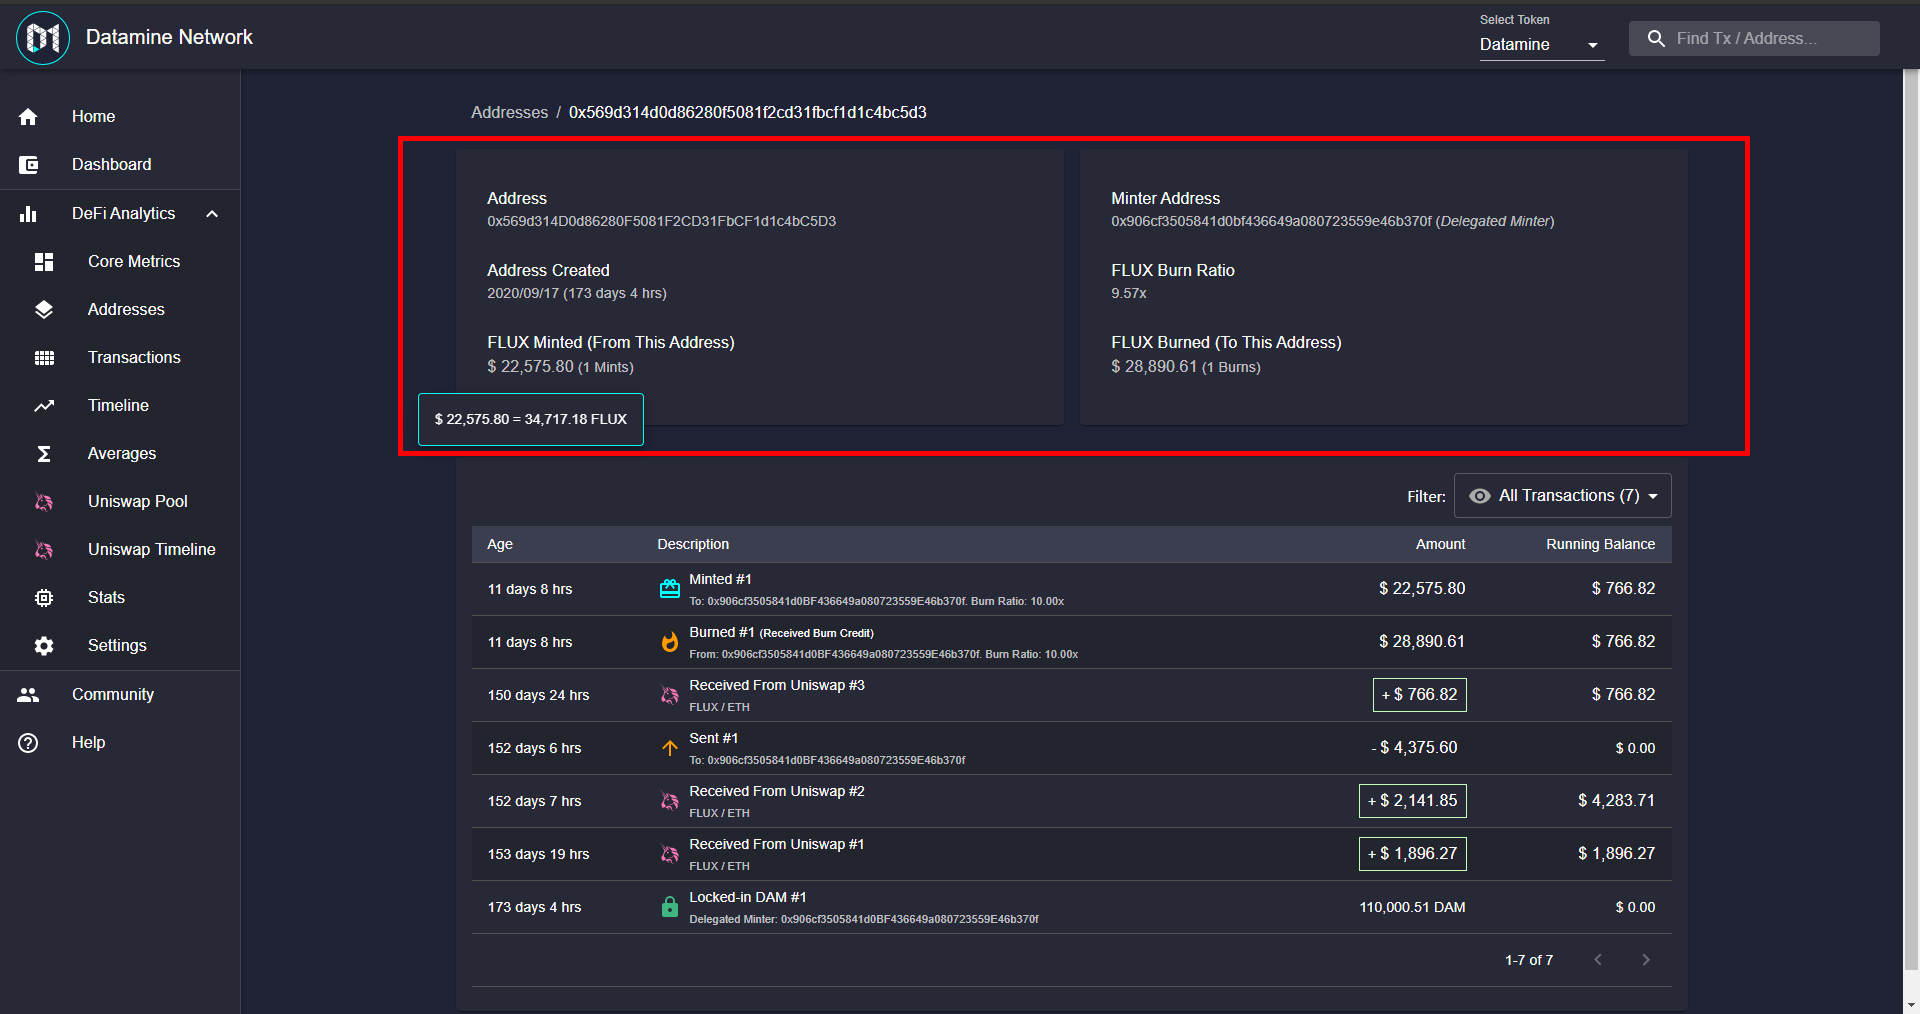
The address details will also get some loving this update. The address details section shrunk in size and also reordered for clarity.
The address details will show real-time USD values for minting & burning. As with any USD prices you can mouse over and get a tooltip of FLUX equivalent.
You'll be able to play with all the new updates very soon! We're getting close with all the USD updates. Farmland will get some loving as well before the launch so they can enjoy all of these new features as well. 🔥
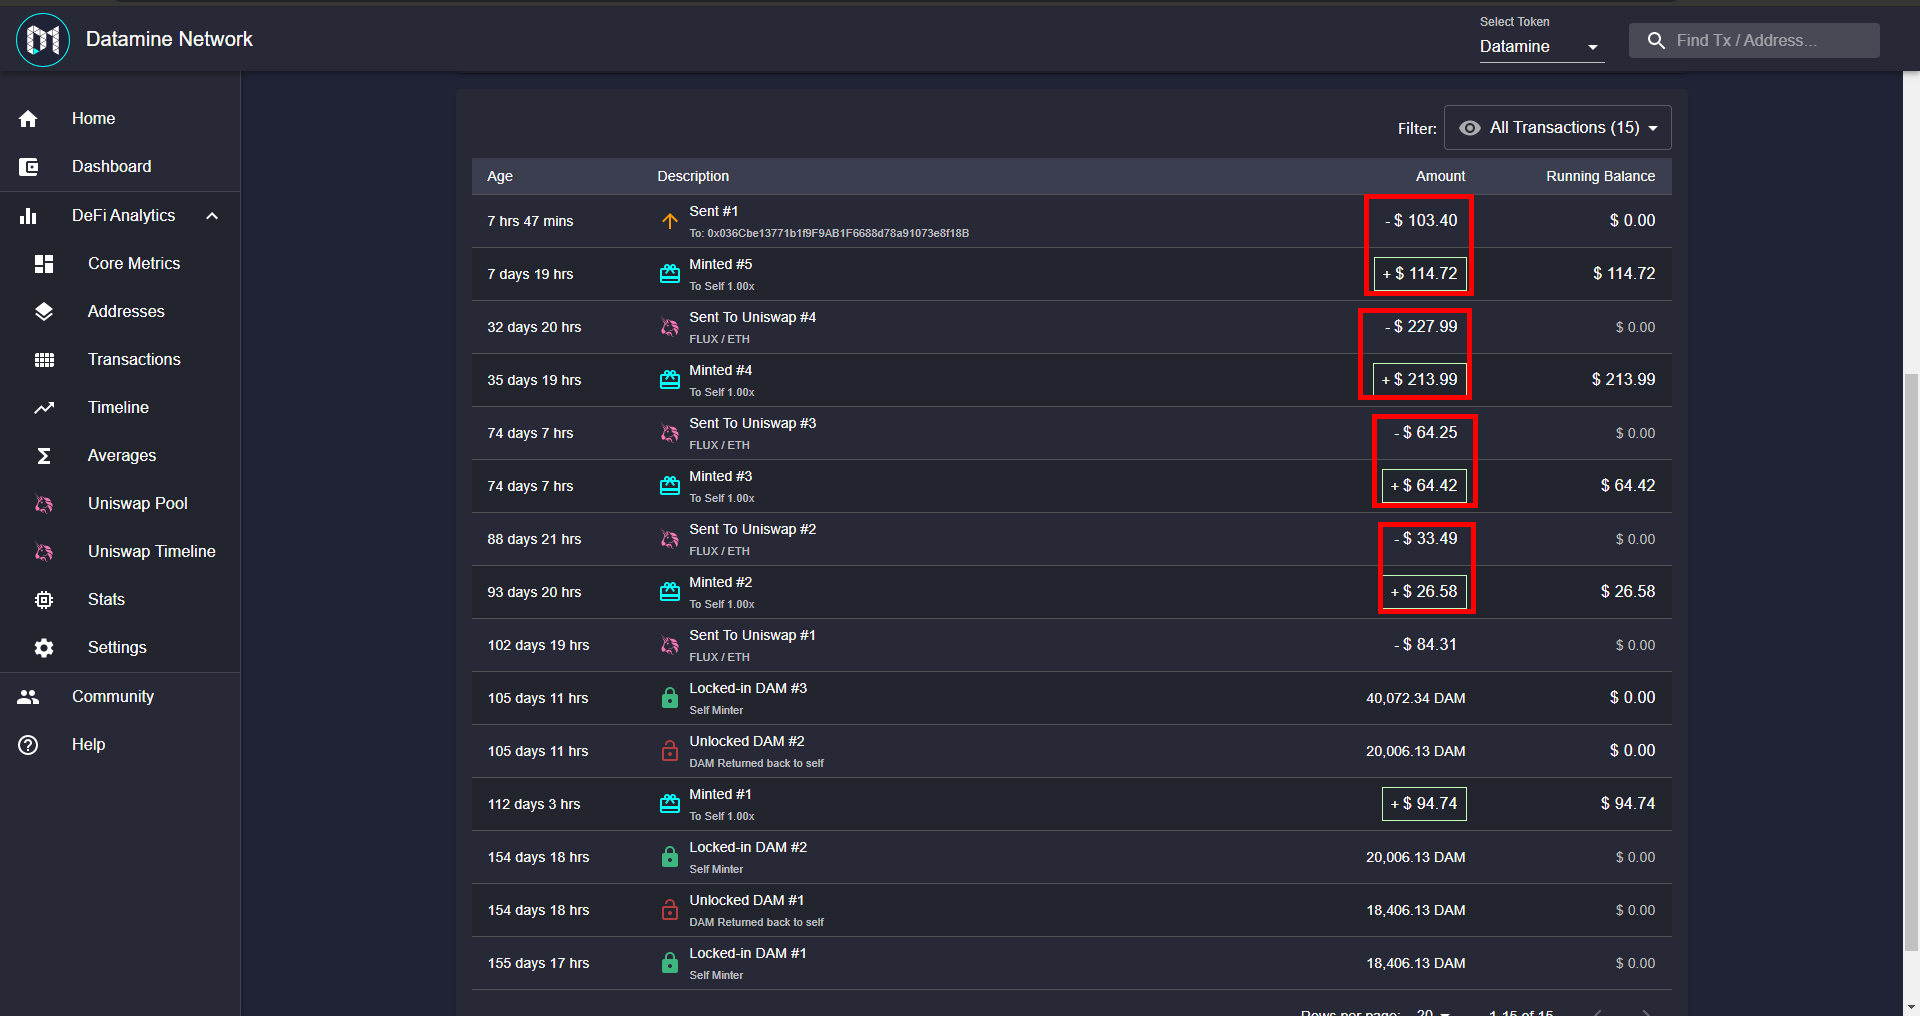
We also get an updated per-address ledger with Running USD balance. The on-chain data is so accurate you will be able to see how much each user mints and sells to Uniswap.
The new ledger features two row layout and some updates for delegated minting (to fix incorrect ratio and "To Self" display).
The new ledger with historical USD prices will give you a very deep understanding of various activities throughout the year. Stay tuned for more historical price updates 🔥
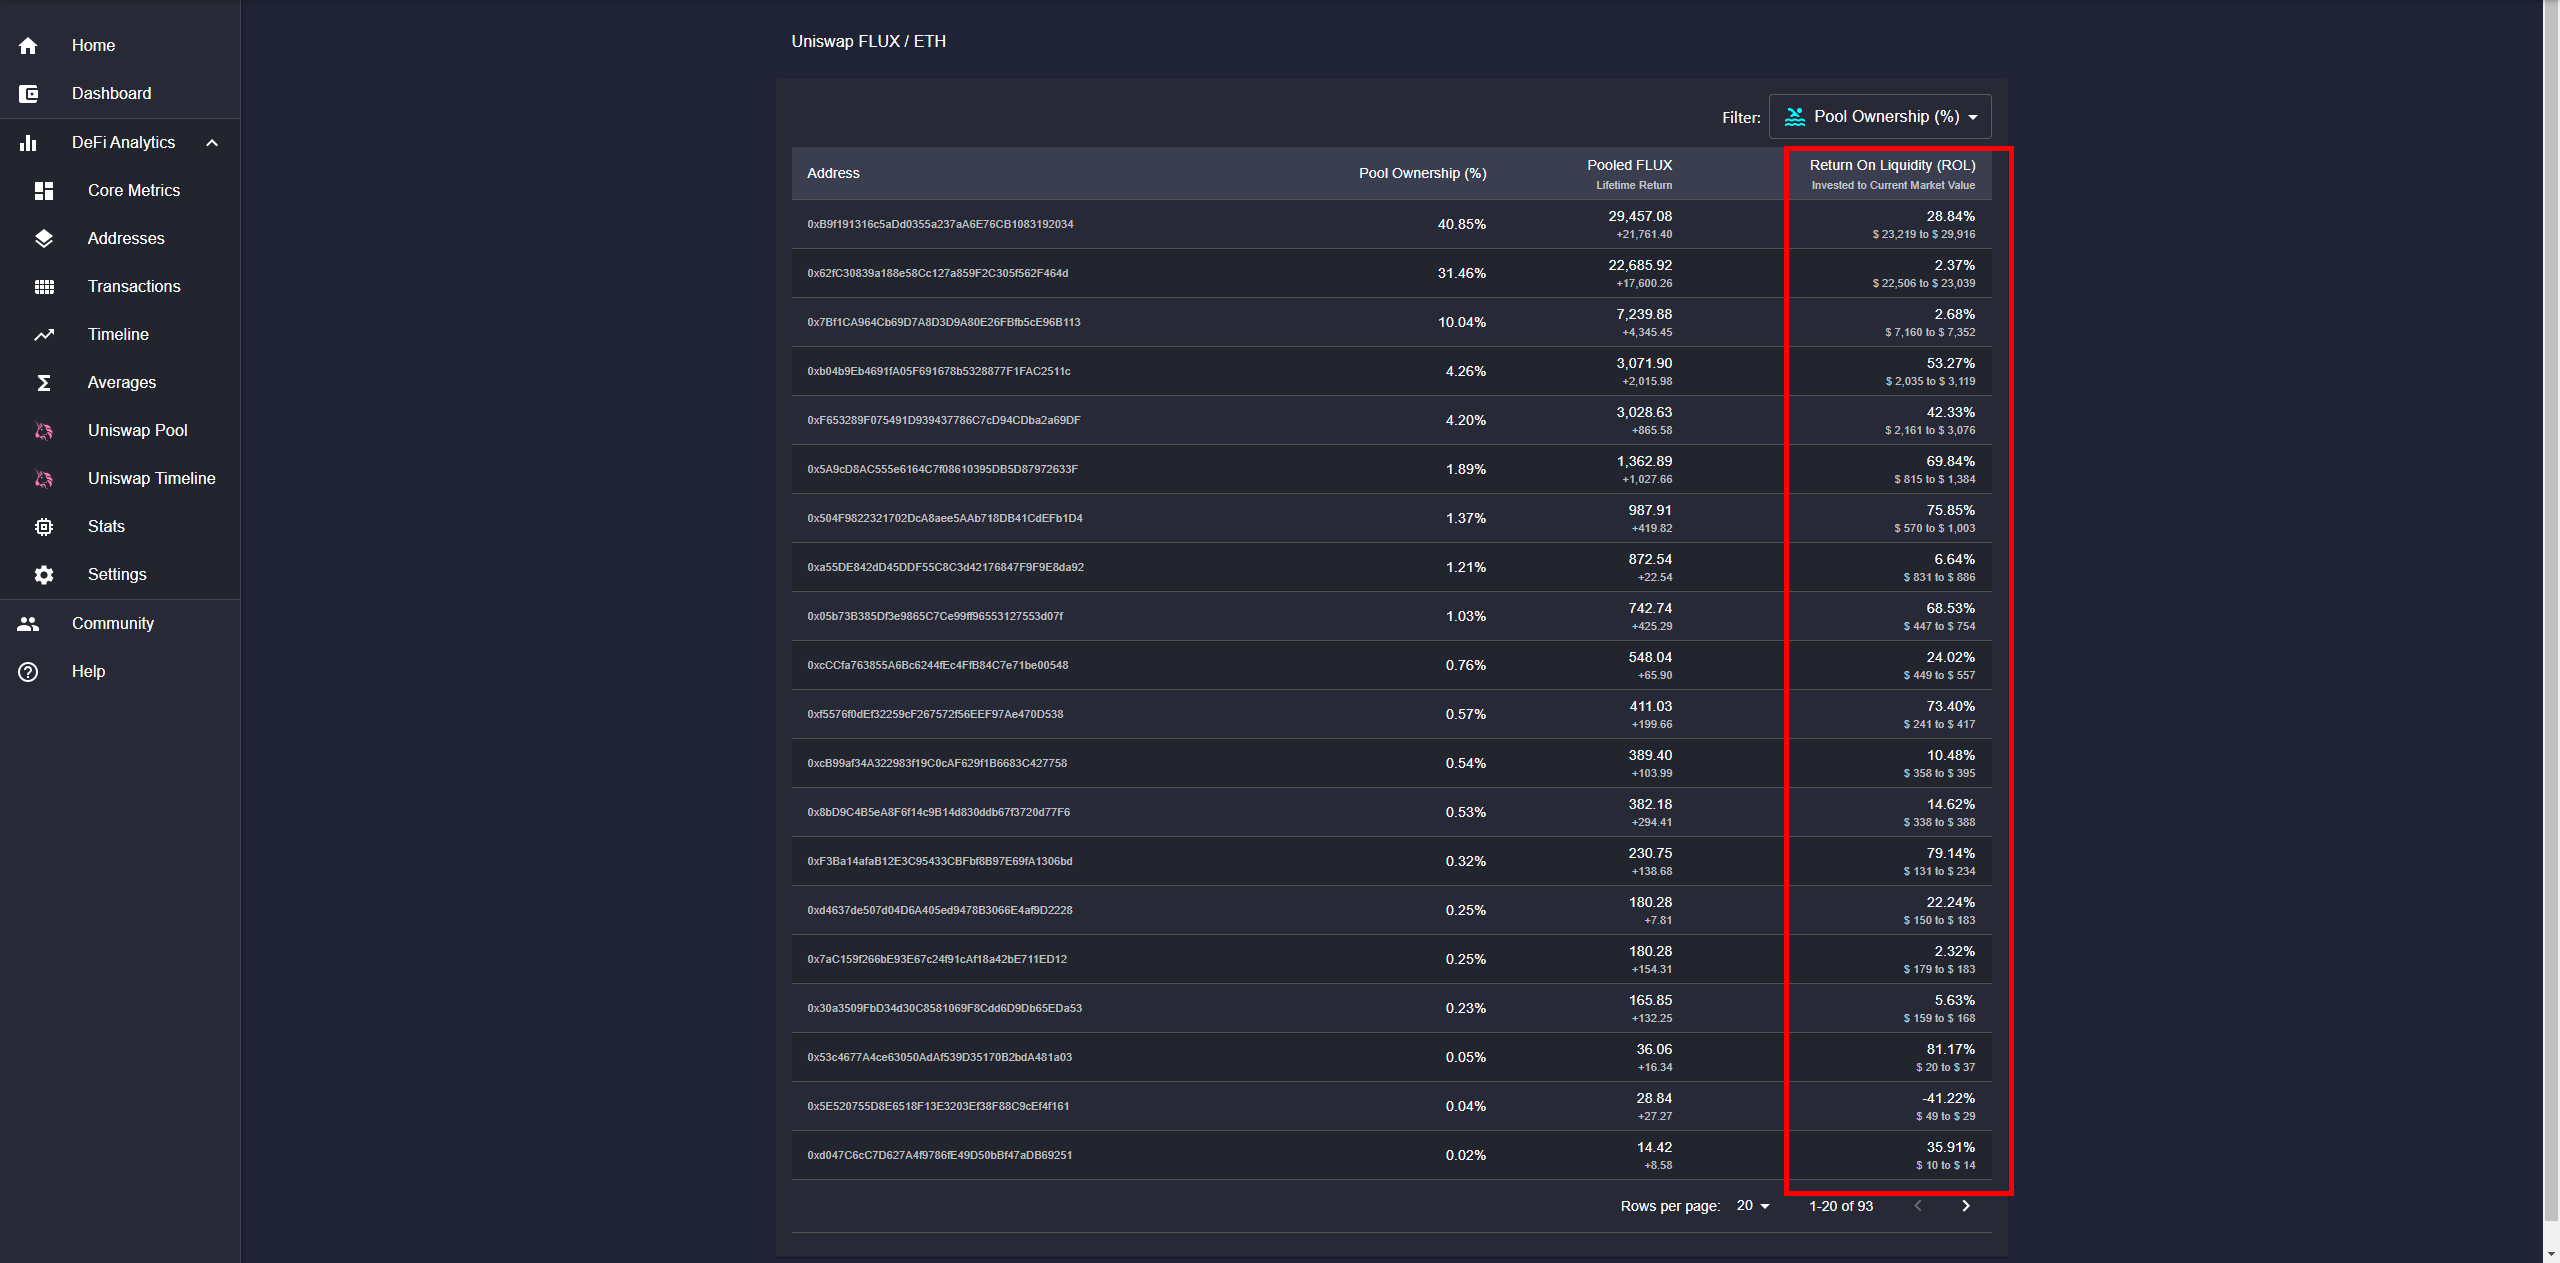
This is the big one I've been working towards: Return On Liquidity (ROL)
You can now see exactly how much each address earned by providing liquidity to FLUX / ETH pool. We'll be adding this functionality to DAM / ETH pool in the future as well.
You can make better trading choices and pick the pool that's right for you.
We're offering this service for our partners so Farmland's CORN will have the same treatment.
There are still a couple more pages to update and give our Historic USD treatment so be sure to follow for updates next week. This is a big update so lots to look forward to! 🔥
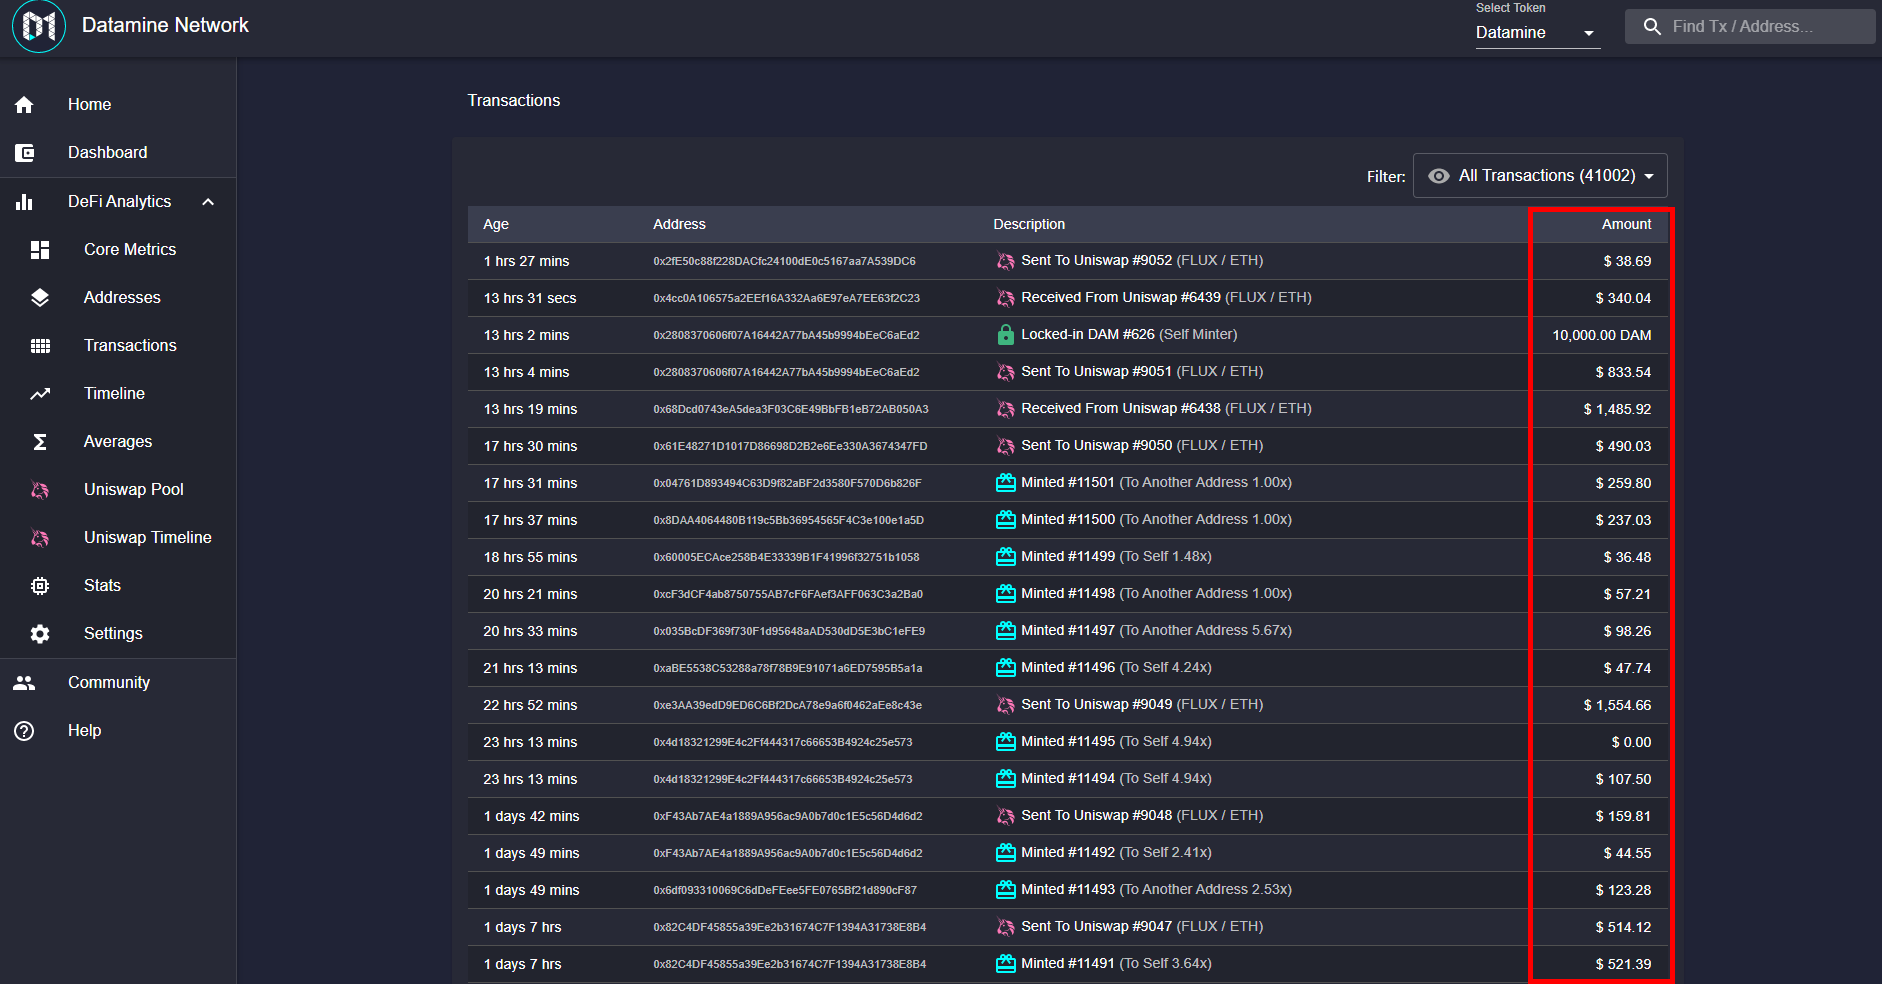
One more: Real-Time Perfect Ledger w/ Historic USD Pricing
Now each transaction will have an accurate USD price (based on Uniswap Data). This will help you understand how much each person burns, mints, buys and sells in USD.
This will also go really well with DAM Uniswap Pool analytics coming later. As you can see how much a person locks-in (USD value) and how much they have minting giving you accurate lock-in ROI proven by on-chain data.
Lots to come still so be sure to follow the updates 🔥
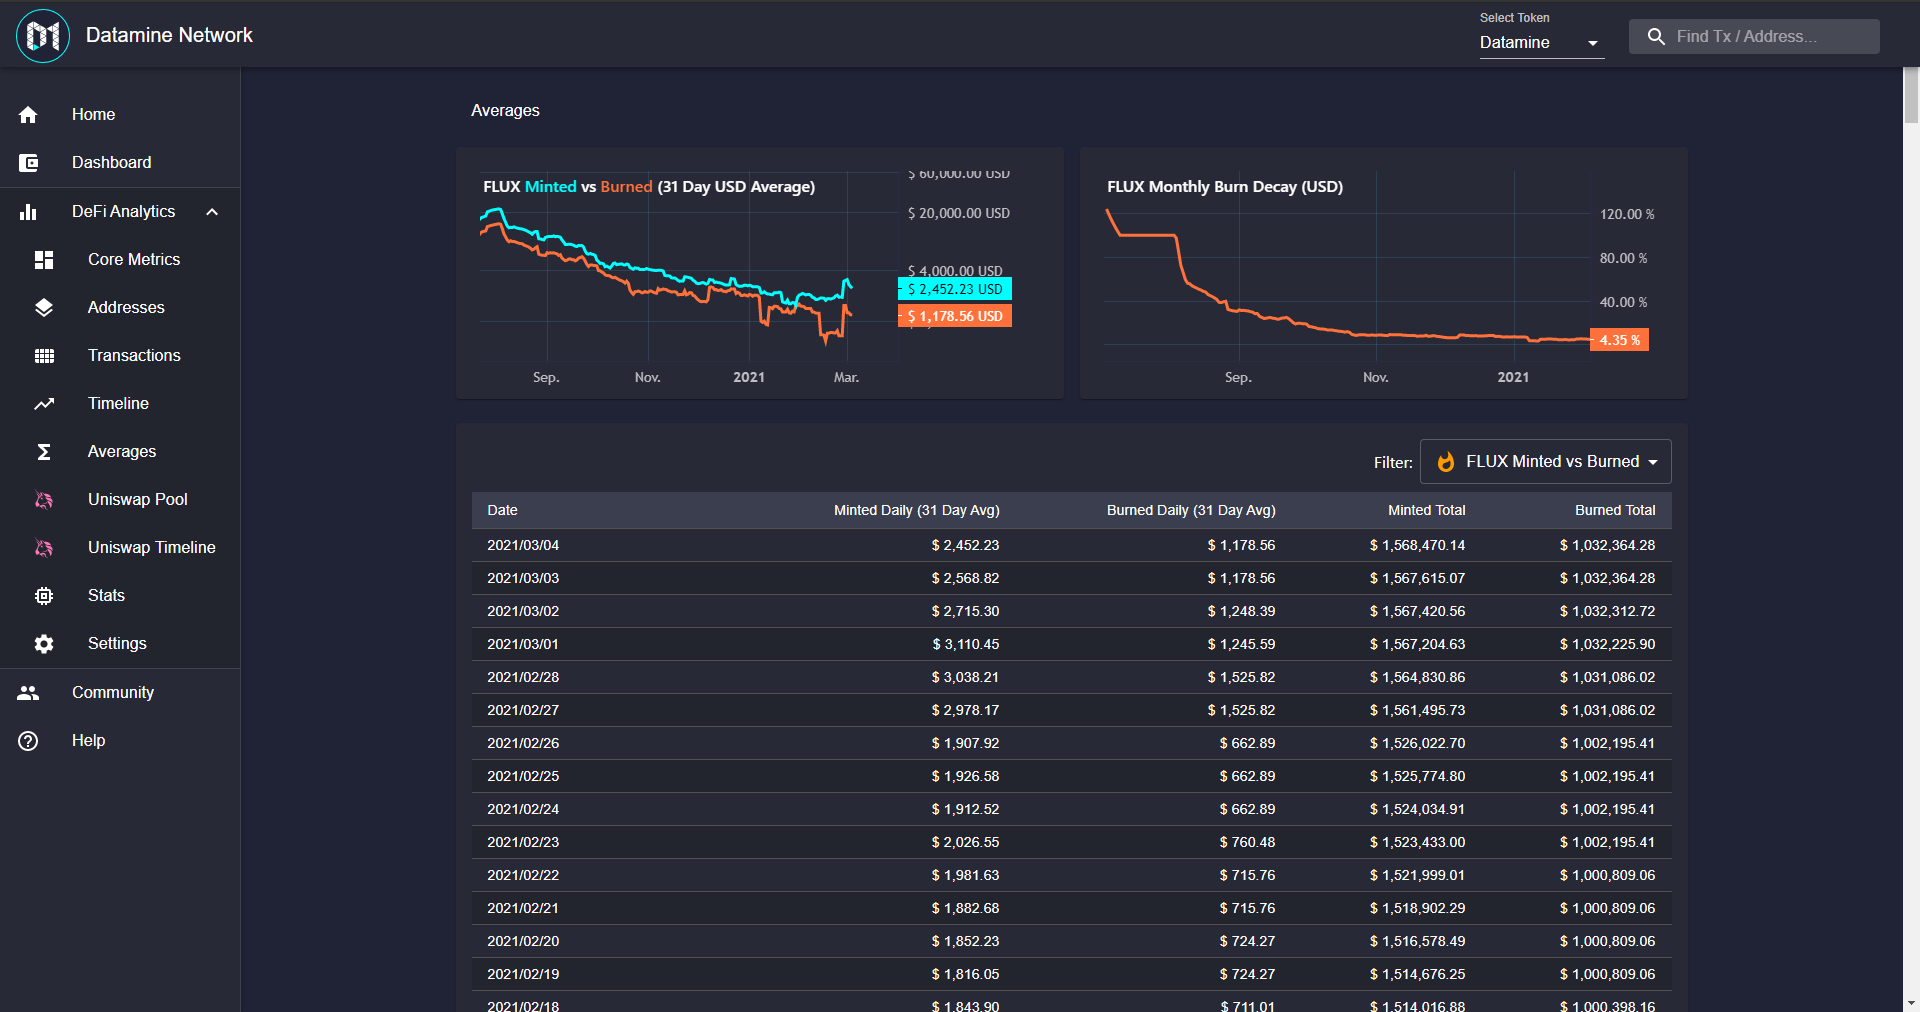
Next up: FLUX Minted vs Burned (31 Day USD Average) and FLUX Monthly Burn Decay (USD)
These two metrics are greatly enhanced with historical USD pricing. Now you can see where burning and minting total USD value is trending. Daily averages for minting and burning will help you understand how much value is added and destroyed on daily basis.
FLUX Monthly Burn Decay (USD) will tell you (based 31 day average) how much less you will mint next month in USD. As the burn decay decreases FLUX ROI becomes more lucrative as your ROI becomes more consistent for burning. Currently getting to 10x burn multiplier would only net in a 3.54% loss in USD mint next month!
As with the theme of historical USD pricing these new data points will help youmake better trading decisions.
Stay tuned for more as we're "upgrading" all data points on Datamine Network with historical USD pricing! 🔥

 · hodlforjesus · #dev-updates
 DAM
DAM FLUX
FLUX · hodlforjesus ·