
Datamine Network Launches Historic FLUX APY Analytics
💡 AI Article Summary
Datamine Network is expanding its decentralized dashboard with the introduction of the Historic FLUX APY timeline. By integrating historical USD pricing for DAM, FLUX, and ETH, the platform now delivers comprehensive insights into long-term yield trends.
Unlocking On-Chain Yield Metrics
This analytics update leverages price feeds from Uniswap V3 to display historical APY metrics stretching back over several weeks. By pulling these immutable on-chain data points, users can easily analyze how yield fluctuates in relation to market conditions and track the critical DAM to FLUX valuation ratio.
These complex analytics have also been designed to support integrations with third-party tracking platforms, including stakingrewards.com, providing broader visibility into the Datamine monetary system.
Data-Driven Decisions for Validators
Understanding historic APY trends is vital for validators optimizing their locking and burning strategies. Access to visual historical timelines allows participants to evaluate the relationship between asset prices and minting yield.
This feature represents the next phase of our advanced data extraction efforts. Because all transactional and pricing data remains permanently recorded on the Ethereum blockchain, we will continue to build out and display new analytical tools on the decentralized dashboard.
Hey guys,
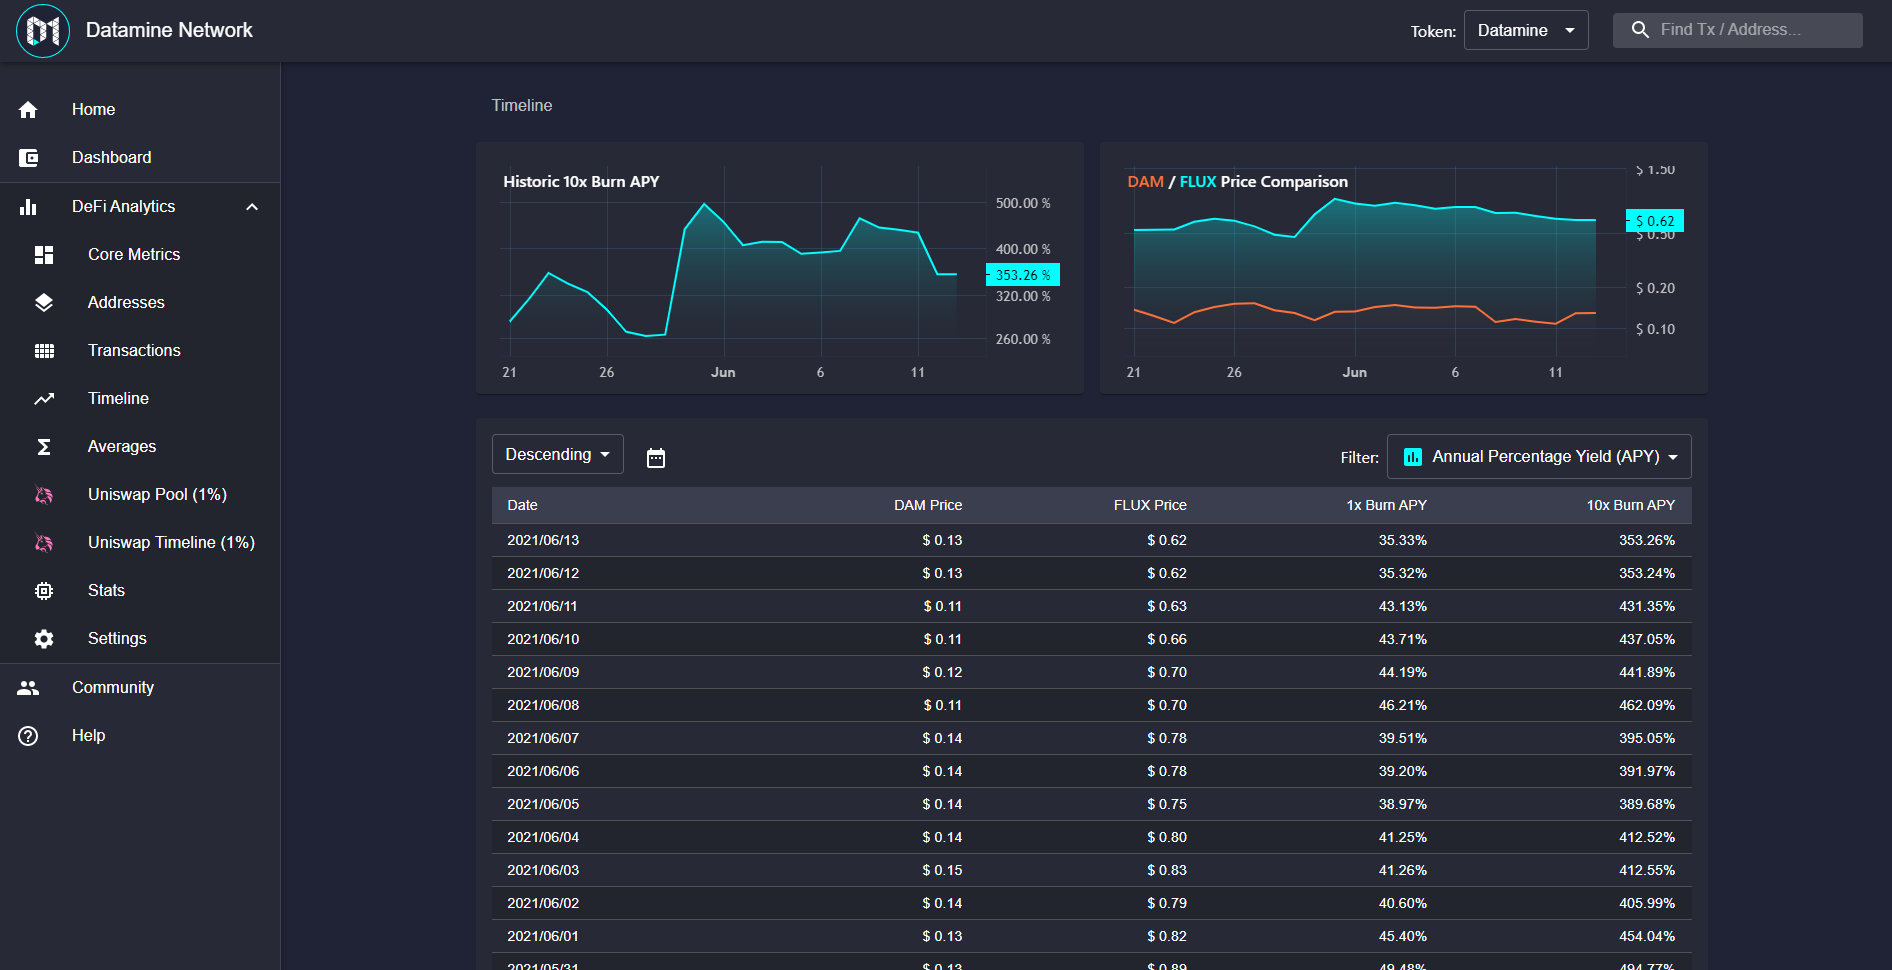
Wanted to share a new timeline data point that will be available tomorrow: Historic FLUX APY
Now that we have DAM prices flowing from Uniswap V3 and I've built a bunch of new analytics for stakingrewards.com, why not display them for all previous historoic data?
Right now you can see APY metrics for a couple of weeks! This will help us understand where APY is trending as well as DAM/FLUX ratio.
As I mentioned before adding DAM, FLUX and ETH historic USD pricing analytics allows us to create complex APY analytics like this.
We're still just scratching the APY surface as all of the data is already on-chain, we just have to extract and display it. Planning to put up this new APY timeline for you to play with tomorrow. 🔥
Frequently Asked Questions
What is the Historic FLUX APY timeline?
It is an analytical tool on the Datamine Network dashboard that displays historical yield metrics for FLUX, allowing users to track APY trends over previous weeks.
How is the historic APY data sourced?
The analytics are generated by extracting immutable, on-chain USD pricing data for DAM, FLUX, and ETH, utilizing price data from Uniswap V3.
Why is the DAM to FLUX ratio important?
Analyzing the ratio between DAM and FLUX helps validators evaluate the relationship between the foundation token and the utility token, enabling more strategic minting and burning decisions.
 · hodlforjesus · #dev-updates