
Datamine Enhances Dashboard Analytics With Interactive Crosshairs
💡 AI Article Summary
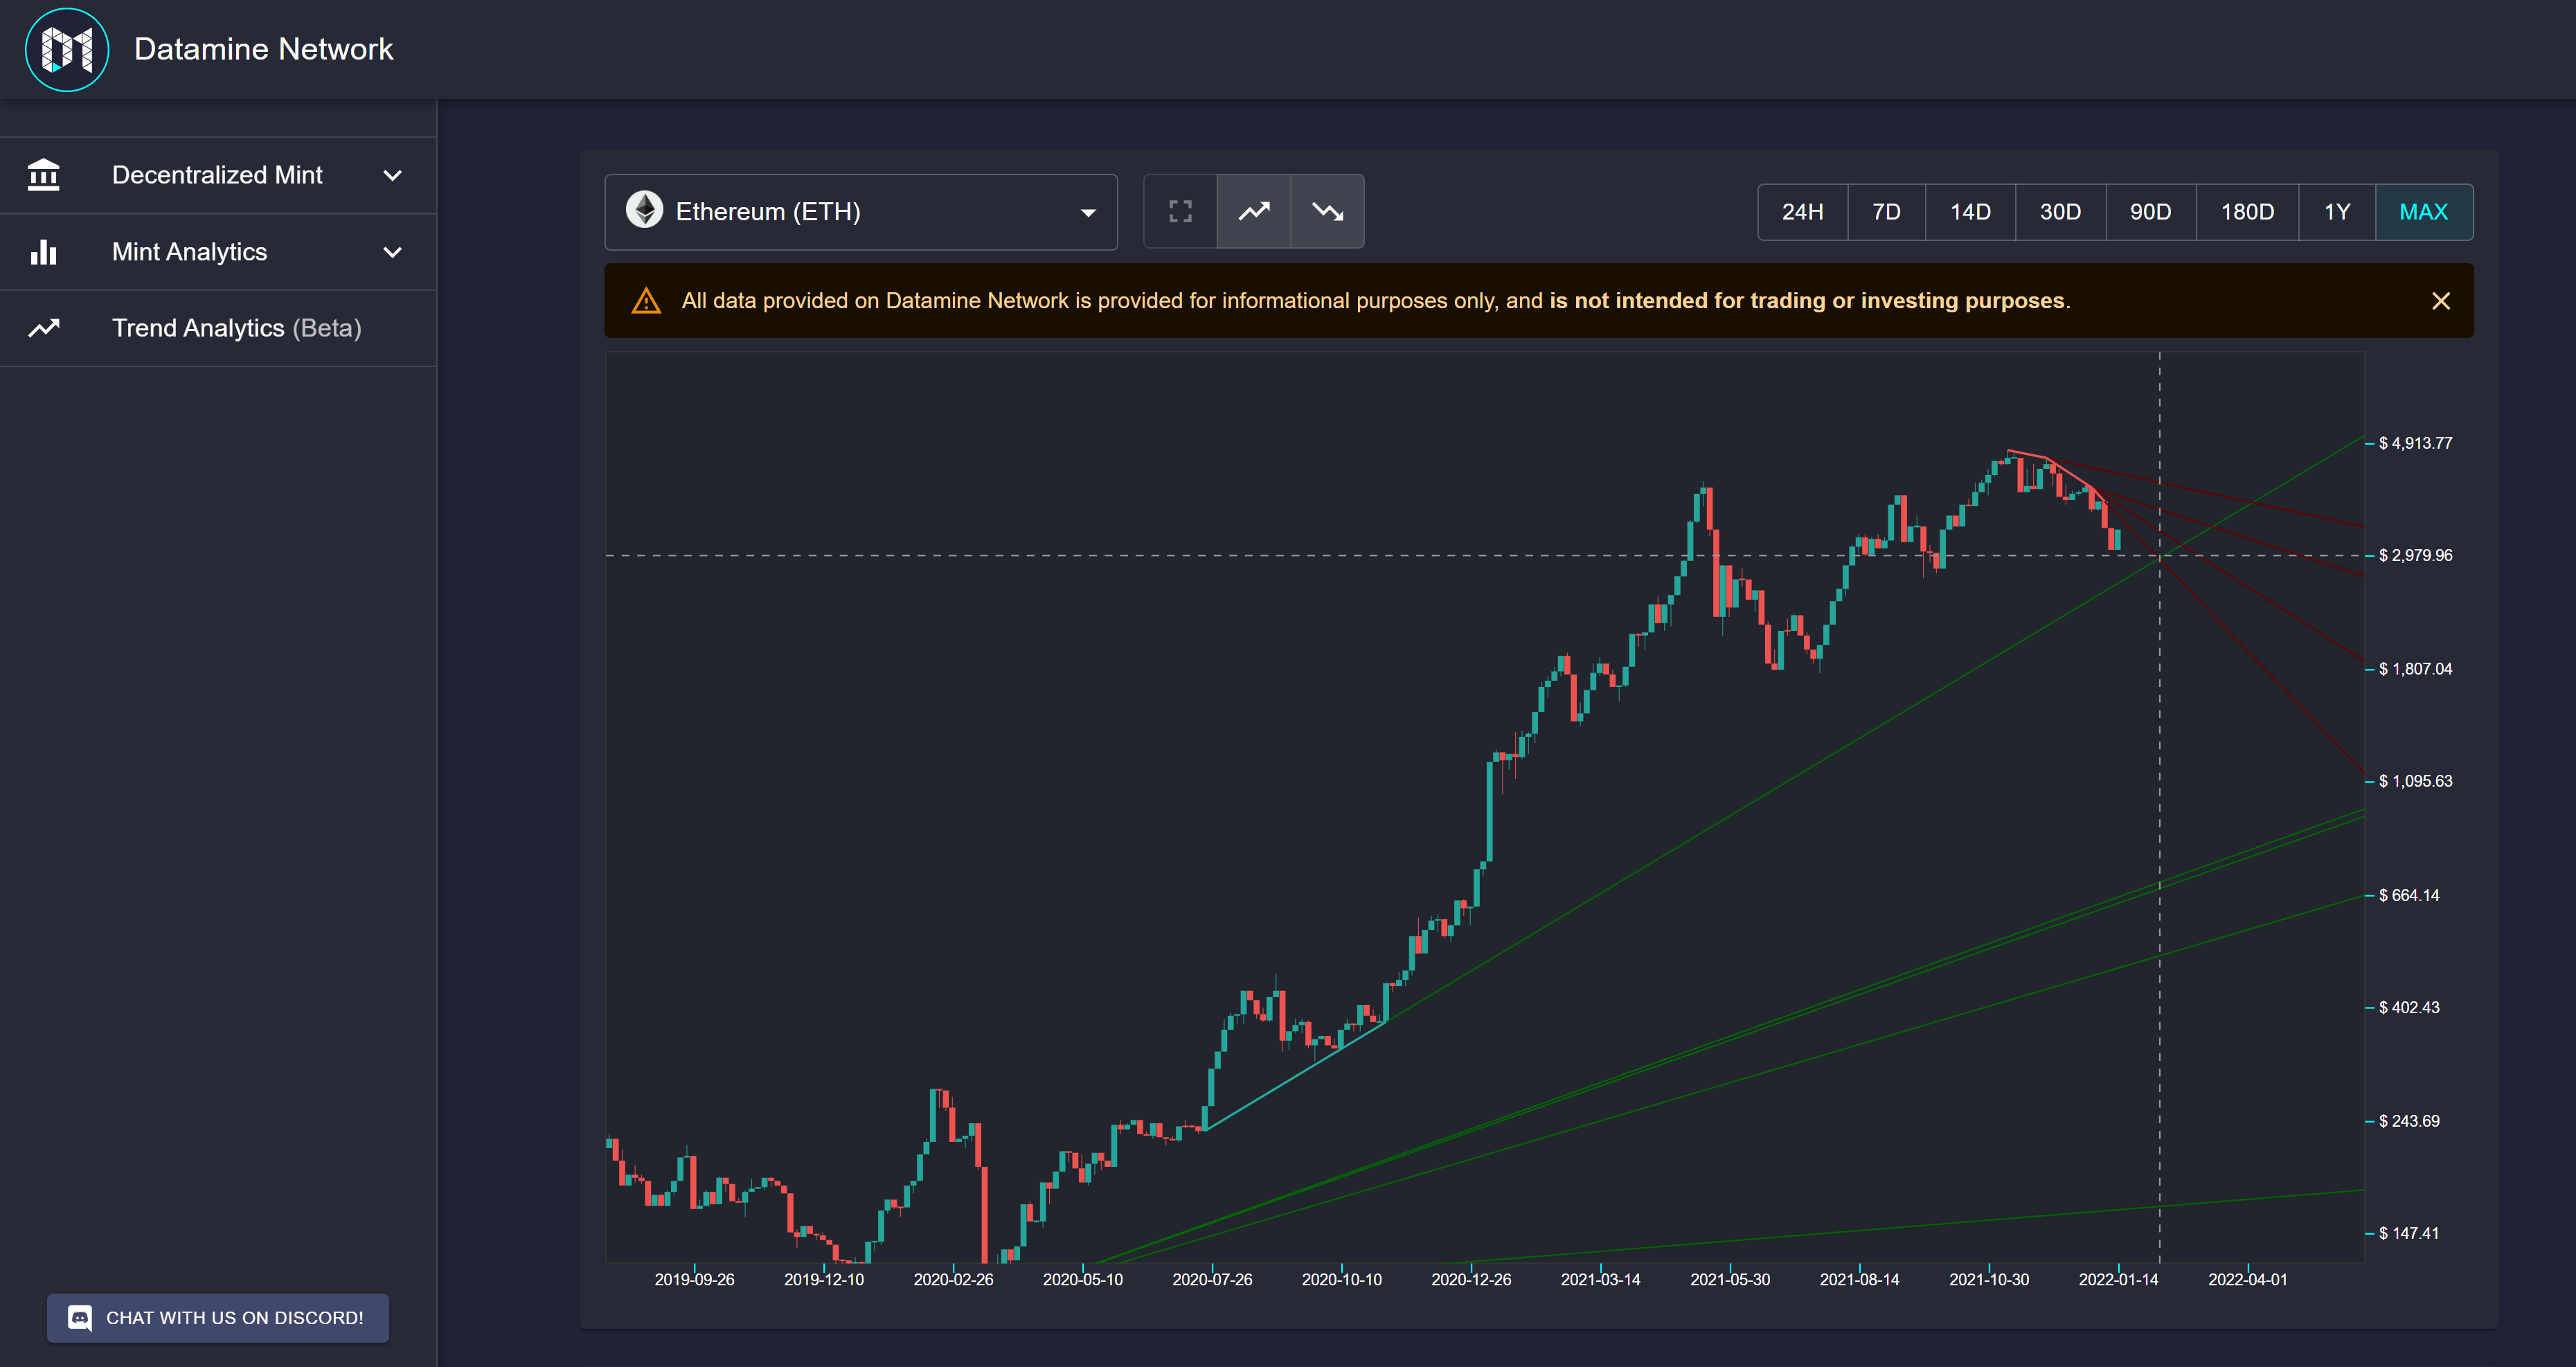
The Datamine Network is introducing an update to its custom-built analytics dashboard: interactive crosshair tracking on trend charts. This new feature directly replicates professional charting tools like TradingView, providing users with a highly responsive cursor crosshair that follows mouse movement over historical data.
Precision Trend Analysis
This update fills a critical gap in the ecosystem's trend analytics suite. By enabling precise, real-time crosshair navigation, users can pinpoint exact prices and corresponding dates directly on the dashboard. This granularity makes it significantly easier to evaluate key historical trends, token emission milestones, and market dynamics across all ecosystem tokens, including DAM, FLUX, and LOCK.
Advancing Custom Blockchain Analytics
Unlike projects that rely on generic third-party interfaces, Datamine builds its on-chain tracking and data visualization dashboards entirely from scratch. This custom approach ensures that metrics such as available liquidity, token burn percentages, and inflation curves are displayed clearly.
The crosshair feature is scheduled for release tomorrow, further enhancing the tools available for tracking the performance of the network's decentralized monetary system.
Hey guys,
I am almost done with the "crosshair" portion of the trend analytics. Now when you mouse over the chart you will see a crosshair following you. I am trying to replicate Tradingview functionality for crosshair so there is a bit more work left to match it.
This is a big missing piece of trend analytics as having a crosshair will help you understand at what price and date some trends will be tested.
Aiming to get this released Tomorrow 🔥
Frequently Asked Questions
What is the new crosshair feature on the Datamine dashboard?
The crosshair feature is an interactive charting tool that replicates TradingView-like functionality. It allows users to hover over trend charts and view precise price and date coordinates aligned with their cursor.
Why is this chart update important for Datamine users?
It enhances trend analytics by making it easy to identify historical price points, dates, and testing ranges. This is critical for assessing the performance and supply dynamics of ecosystem tokens like DAM, FLUX, and LOCK.
Are Datamine's analytics charts imported from external services?
No. All core metrics, dashboards, and analytical charts on the Datamine Network are custom-built from scratch to maintain alignment with the platform's commitment to high-fidelity, real-time on-chain data.
 · hodlforjesus · #dev-updates